Принимая во внимание все типы опасных природных явлений, оползни имеют очень хороший потенциал для их пространственного и временного прогнозирования.
Ответы на вопросы «где?» и «почему?» произойдет движение масс, зависят от типа движения и на него можно более или менее легко ответить, анализируя геологические, геоморфологические и геотехнические данные, используя исторический опыт, содержащий архивы, фотографии и результаты исследований.
Ответ на вопрос «когда?» может быть получен путем анализа климатических данных и зафиксированных событий (при неизменности других факторов).
Схождение или реактивация оползней может быть объяснена несколькими типами климатических ситуаций.
Однако некоторые оползни не имеют никакого отношения к климатическим условиям, будь то недавние или более отдаленные события.
Определены три основные возможные ситуации, в зависимости от типа оползня:
- проливные дожди в течение короткого периода,
- длительные осадки в течение различной продолжительности с достижением порога срабатывания,
- большое совокупное количество осадков в течение длительного периода.
Большое разнообразие явления показало, что условия схождения оползня не может быть унифицировано.
Нестабильность может произойти даже после относительно сухих месяцев, независимо от того предшествовали ли они большому годовому количеству осадков. С другой стороны, сильных дождей, выпавших в предыдущие годы или десятилетия, может быть достаточно, чтобы вызвать нестабильность, даже если небольшой дождь прошел в течение последних лет.
Тип оползня, конечно, играет фундаментальную роль в этих взаимоотношениях.
Риск, связанный с движением земли, может быть уменьшен и защита может быть обеспечена, в результате профилактических работ двух типов:
- активная защита, которая в основном включает глубокий дренаж и восстановление лесов;
- пассивная защита, которая касается материалов, которые могут быть вовлечены в движение. Она обычно связана с созданием террас, перепрофилированием и созданием подпорных сооружений.
В случаях повышенного риска, где существует значительная уязвимость и нет способа снижения опасности, должен быть обеспечен мониторинг склонов. Вообще движение поверхности и изменение уровня грунтовых вод, должны записываться непрерывно и предупреждение должно осуществляться автоматически, когда превышен фиксированный порог.
Больше информации 8.1. More information on landslides prevention, prediction and protection)
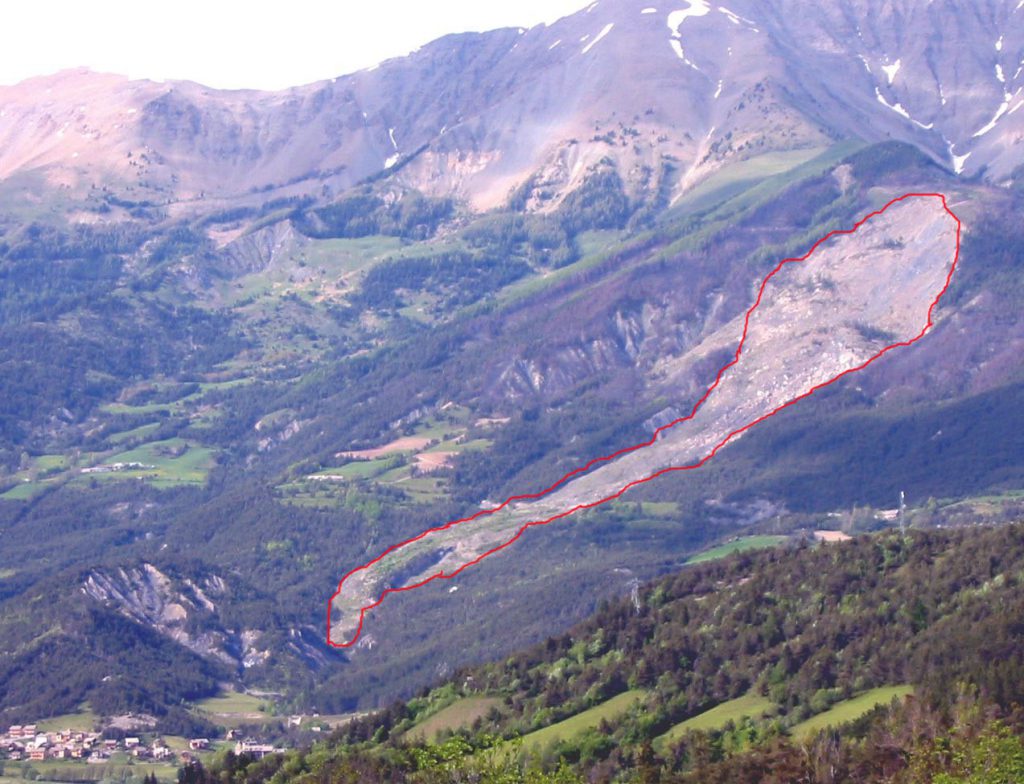
The prevention of disasters due to landslides involves defining where a given type of movement will occur — the zone in which the probability of the occurrence is greatest. The answers to the questions “where?” and “Why?” depend on the type of movement and are more or less easy to answer. Maps and documents written have been compiled by analysing geologic, geomorphologic and geotechnical data, using a historical inventory containing archives, photographs and the result of local investigations. The data may be analysed by statistical probability methods, using a GIS (Geographical Information System), for example, to demonstrate the respective weight of the various instability factors (Turner and Schuster, 1996).
The geological, geomorphological data on landslides involves research into indications of instability and the geotechnical information. The data may be analysed by statistical probability methods, using a GIS (Geographical Information System), for example, to demonstrate the respective weight of the various instability factors (Turner and Schuster, 1996).
(go to 8.1.1.More information on landslide investigation techniques)
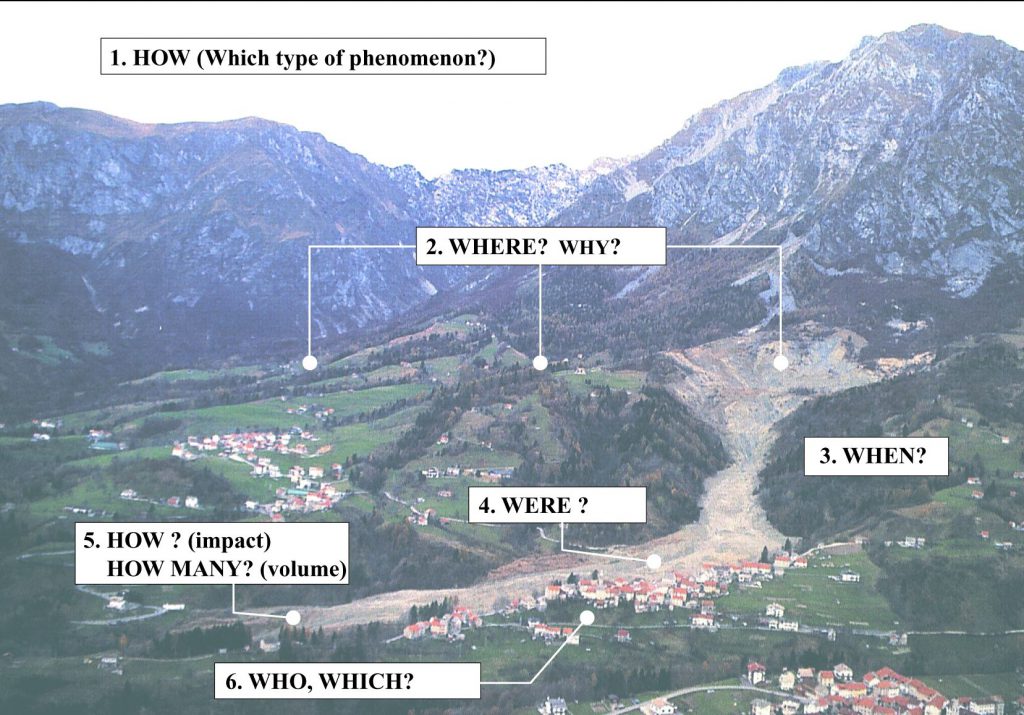
The answer to the question “When?” is obtained by analysing climatic conditions, in the vicinity or at a distance, which encourage instability and by establishing a relationship between the recorded earth movements (Maquaire, 1990; Matthews et al., 1997; Flageollet et al., 1999).
This amounts to defining the types of climate and their relationship to landslides. Flageollet et al. (1999) showed that the triggering or reactivation of landslides may be explained by several types of climate situation. However some landslides bear no obvious relation to climatic conditions, be they recent or more distant. They defined three main situations, depending on the type of landslide:
- heavy rainfall over a short period,
- cumulative rainfall over a period of varying duration with establishment of a triggering threshold
- cumulative rainfall over a period of varying duration without identification of a triggering threshold.
The great diversity of the phenomena indicated that the conditions triggering them cannot be uniform. For deep slides, they involve the analysis of rainfall over previous weeks or months and the resulting piezometric variations must be taken into account, whereas for surface mudslides it is the intensity and quantity of rain falling over previous days and hours that is most relevant. In general, at a regional level there is a wide diversity in the relationships between the different types of landslide recorded and the climatic conditions, giving rise to a number of complex combinations. As frequently observed elsewhere, rainfall is only one element of the system that accelerates or triggers landslides and is combined with other factors, such as land-use. Generally, however, it is by far the most important element of the system.
Instability can even occur following relatively dry months, whether or not they are preceded by heavy annual rainfall. Conversely, heavy rainfall in earlier years or decades can be enough to trigger instability even if little rain has fallen over the preceding years. The type of landslide, of course, plays a fundamental role in this relationship. The complexity of relations between landslides and climatic conditions makes it difficult to define “universal laws”. Before that happens, further investigation is needed into such relations in a given area, taking account of the types of landslide, their generation (triggering or reactivation), the season of occurrence and, finally, the resulting initial degree of slope stability.
The risk from earth movements can be reduced and protection can be assured by preventive or curative works of two types. Active defence tackles the causes of the active or potential and mainly involves deep drainage or reforestation. Passive defence contains the materials which are or may be in movement, which generally involve terracing, reprofiling and retaining structures. For example, in some natural or artificial underground spaces in urban zones the space is frequently filled by injecting concrete, sand and bentonite.
In high-risk cases where there is considerable vulnerability and no way of reducing the hazard level the slopes must be monitored. Generally surface movements and variations in the water level are recorded continually and an alert is sounded automatically when a fixed threshold is exceeded.
In France, for example, two main sites in the Alps are fitted with instruments – the Clapière landslide at St. Etienne-de-Tinée (Alpes-Maritimes) and the rockfall at the “Ruines de Séchilienne” near Vizille (Isère)
(http://www-lgit.obs.ujf-grenoble.fr/observations/omiv/SECHILIENNE/index.html). Some sites are also fitted with instruments to serve as observatories for scientists involved in national or international research projects, in order to provide a better understanding of the various development processes and to develop and validate predictive models. The experimental site of the Super-Sauze earthflow (Go to 13.4. Super-Sauze,Study case) in the Alpes-de-Haute-Provence has been sounded, monitored and modelled since 1995 (Flageollet et al., 2000; Malet et al., 2000; Malet et al., 2001; Maquaire et al., 2001).
(Go to 13.7. Tessina Study case. To be sent by Pasuto)
Go to 8 Can LANDSLIDES be predicted?
Investigation of existing landslides and sites of potential landslides plays an important role in landslide loss mitigation and in landslide research. Landslide investigations are used for different purposes:
- Identification and characterisation of unstable zones: triggering mechanisms? Causative factors (such as earthquakes or high rainfall events)? Estimated velocities?
- Movements monitoring: long, medium and short term behaviour of the unstable slopes? Climatic conditions?
- Movements modelling: how to explain the past movements? How to quantify these movements? How to predict future movements?
- Hazard assessment: what will be the intensity and the frequency of crisis? Which scenario has to be taken into account?
- Planning of stabilisation measures: how to decrease the movements? How to reduce the crises impacts?
Different parameters are needed to be investigated:
- Ground properties: geometry, geology, hydrology, mechanical characteristics (stresses and forces), etc.
- Surface and subsurface displacements
- Groundwater levels and pressures
Several techniques are used to determine these parameters. The figure 1 summarizes these techniques, which concern different domains such as geotechnics, geophysics, hydrology, remote-sensing:
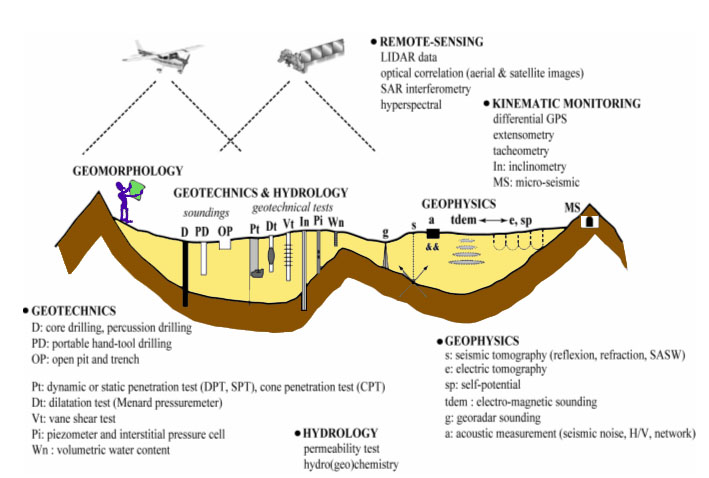
The following parts describe the different methods indicated in the figure 1.
A. Investigations of ground properties:
1. Ground geometry:
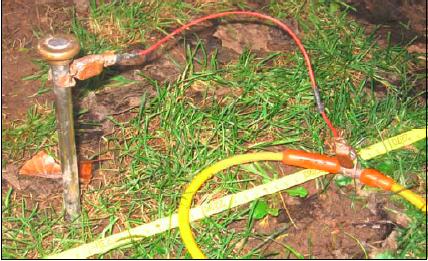
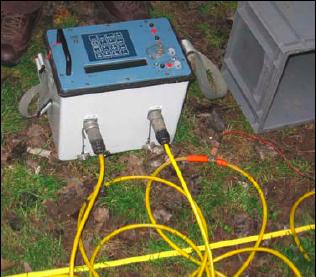
Electrical tomography is a geophysical technique for imaging sub-surfaces structures from electrical measurements made at the surface. An electrical wave is propagated through the ground between two couples of electrodes anchored at the surface (A-B and M-N, figure 2). The resistivity of the terrain is measured. The more distant the couples of electrods are, the deeper the ground is investigated. Thus, resistivity is measured between different couples of electrodes along a line (figure 2).
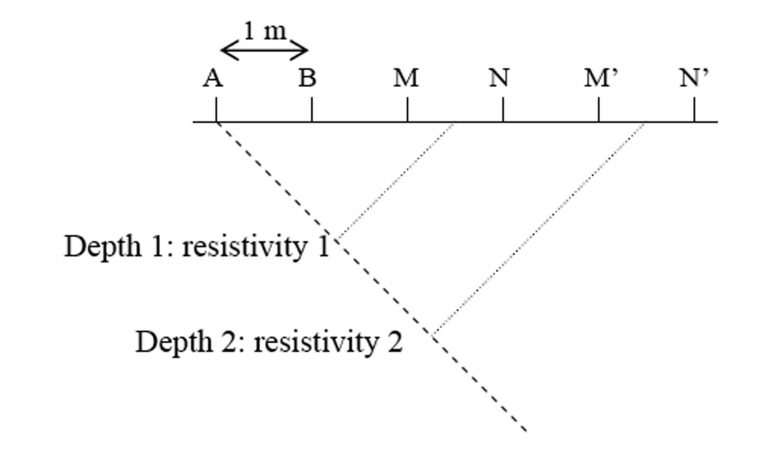
Analysis of the resistivity values allows to determine the presence of different geological layers and their properties (nature, thickness). Indeed, different materials have not the same resistivity value (from Filliat, 1981):
| Material | Resistivity (ohm/m) |
|---|---|
| Clay | 3-30 |
| Marl | 10-100 |
| Schist | 30-300 |
| Sand and gravel | 100-1000 |
| Limestone | 300-3000 |
| Crystalline rocks | 1000-10000 |
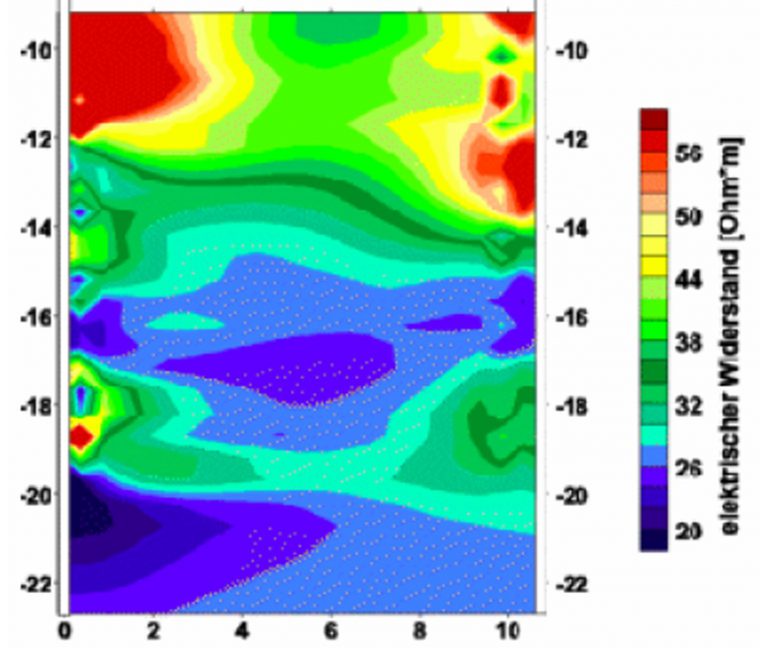
Combination of the resistivity values allows to give information about ground structure in two dimensions (2D), establishing a resistivity profile (figure 3). It is possible to image ground to a depth of 100 metres.
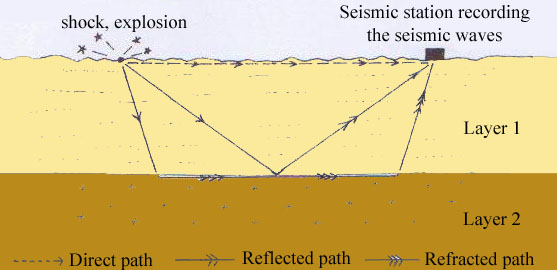
Seismic tomography is also a geophysical technique for imaging sub-surfaces structures. It uses digital seismographic records to image the interior of the ground and thus determine geometry of the stratigraphic layers. An artificial seismic wave (acoustic wave) is generated by a shaking (explosion) at the ground surface. This seismic wave is propagated through the ground, directly or by refraction or reflection. Layers of different geological nature modify direction and velocity of the wave (figure 6).
The time that the wave arrives at the seismic station is used to calculate the speed of the wave and to determine the presence of layers and some of their physical properties (density, thickness, etc.). Indeed, as the density of the material increases, the speed of the wave also increases (from Filliat, 1981):
Material Velocity (m/s)
Mud and peat 50
Clay and silt 400-1500
Sand and gravel 300-1200
Altered rocks 800-2500
Massive rocks 2000-6000
Combination of values from several transmitting and receiving stations allows to give information about ground structure in 2D or 3D.
Georadar, or Ground-penetrating radar (GPR) is an other geophysical technique for imaging sub-surfaces structures. It uses electromagnetic radiation in the microwave band of the radio spectrum, and detects the reflected signals from subsurface structures. GPR uses transmitting and receiving antennas. The principles involved are similar to seismic tomography, except that electromagnetic energy is used instead of acoustic energy: the transmitting antenna radiates short pulses of the radio waves into the ground. When the wave hits a boundary with different dielectric constants, the receiving antenna records variations in the reflected return signal (figure 7).
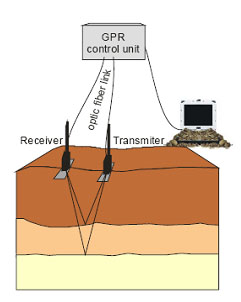
To carry out investigations on a large terrain, the distance between the two antennas remains constant and the couple of antennas is moved, or the middle between the two antennas remains constant and each antenna is moved.
The depth range of GPR is limited by the electrical conductivity of the ground (100 mS/m), and the transmitting frequency. As conductivity increases, the penetration depth also decreases. Higher frequencies do not penetrate as far as lower frequencies, but give better resolution. Frequencies between 10 MHz and 1,5 GHz are generally used.
Depth penetration can reach 50 m. Optimal depth penetration is achieved in dry sandy soils or massive dry materials such as granite, limestone, and concrete. In moist and/or clay laden soils and soils with high electrical conductivity, penetration is sometimes only a few centimetres.
2. Mechanical characteristics:
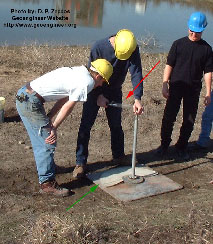
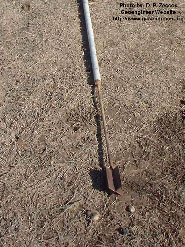
Vane shear testing is a geotechnical method. It is one of the most common in situ methods for the estimation of the undrained shear strength of soils. The equipment consists of a stainless steel vane, consisting of four rectangular blades, attached to the end of a steel rod. The vane is introduced into the ground to the depth where the measurement of the undrained shear strength is required. Then it is rotated and the torsional force required to cause shearing is calculated (figure 8). Figure 9 shows a manual vane shear test. The vane is rotated at a specified rate that should not exceed 0,1 degrees per second. The amount of rotation is specified in the green arrow whereas the red arrow has a device that measures the required Torque.
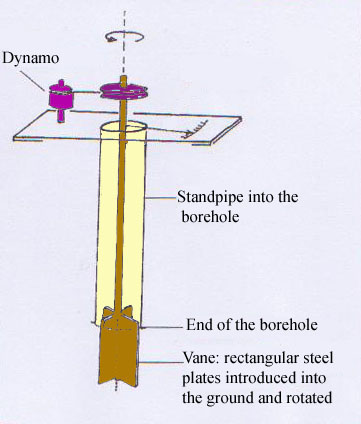
This test is particularly well suited to measurements in soft clays.
Penetration test is also a geotechnical method. Penetration can be dynamic or static. It provides information on the penetration resistance and on the density of the material.
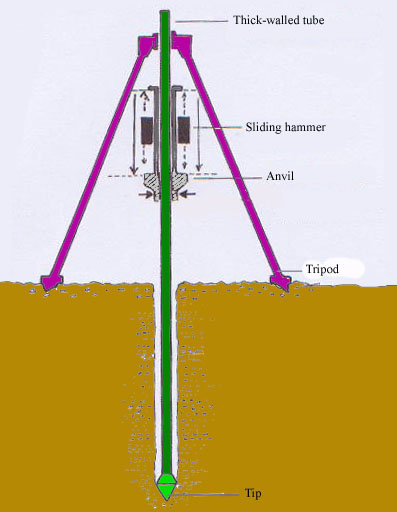
The dynamic penetration test uses a thick-walled sample tube which is driven into the ground by blows from a sliding hammer (figure 11). The sample tube is driven 150 mm into the ground and then the number of blows needed for the tube to penetrate each 150 mm is recorded. The sum of the number of blows required for the second and third 150 mm of penetration is the «standard penetration resistance,» or the «N-value». The blow count provides an indication of the density of the ground, and it is used in many empirical geotechnical engineering formulae.
The main purpose of this test is to give information about the relative density of granular deposits such as gravels, sands or sandy clay from which it is often impossible to obtain undisturbed samples to study in laboratory. In conditions where the quality of the undisturbed sample is suspect, it is often advantageous to alternate the sampling with standard penetration tests to check the strength. The following table indicates standard values of penetration resistance for some materials (from Filliat, 1981):
Material Penetration resistance (MPa: 1 MPa = 10 bars)
Soft clay 0,02-0,2
Compact clay 0,2-0,8
Clayey sand 0,3-5
Sand 1,5-10
Sandy gravel 5-50
Finally, the dynamic penetration test is simple and inexpensive.
The cone penetration test is a static test which also measures the penetration resistance. It is rather used to investigate soft soils. It consists in pushing a cone tip into the ground at a constant and controlled rate (usually 2 centimeters/second). The resolution of the cone penetration test in delineating stratigraphic layers is related to the size of the cone tip, with typical cone tips having diameters of around 4 cm.
The original cone penetrometers involved simple mechanical measurements of the total penetration resistance. Different methods were employed to separate the total measured resistance into components generated by the conical tip and friction generated by the rod string. Now, modern electronic cones also employ a pressure transducer with a filter to gather pore water pressure data. It aids determining stratigraphy and is primarily used to correct tip friction values. Moreover, the basic penetration probe has now additional instruments such as geophones or accelerometers to allow seismic investigations, or cameras for capturing video imagery.
Finally, compared to the dynamic penetration test, the cone penetration test is gaining popularity by its increased accuracy, speed of deployment and reduced cost.
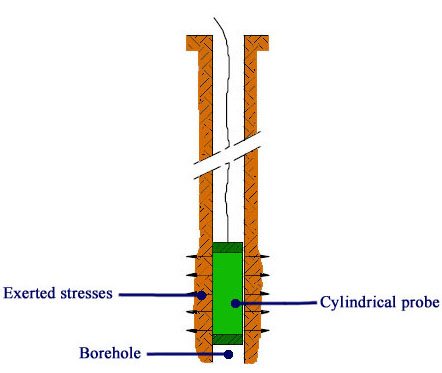
Pressuremeter and dilatometer tests are also in situ geotechnical methods, which are loading tests run up to soil failure. They consist in pushing a cylindrical probe into a borehole. The diameter of the probe can be expanded by injecting pressurized air. These stresses are exerted on the walls of the borehole at different depths in order to determine layers the most sensitive to deformations (figure 12).
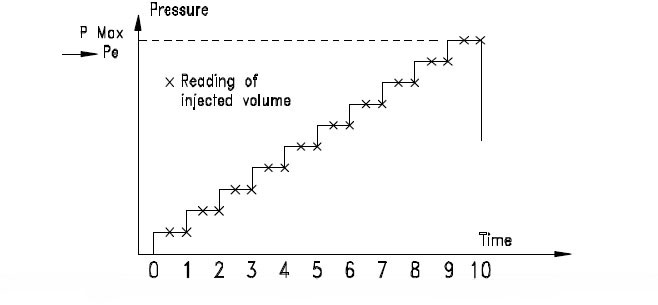
For a given depth, a pressuremeter test consists in regularly increasing the pressure and measuring the volume increment. The Menard test, which is called the normalized test must comprise about 10 steps of pressure of equal increment. The readings of the deformations are made at each step of pressure 15 seconds, 30 seconds and 1 minute after reaching the pressure level (figure 13).
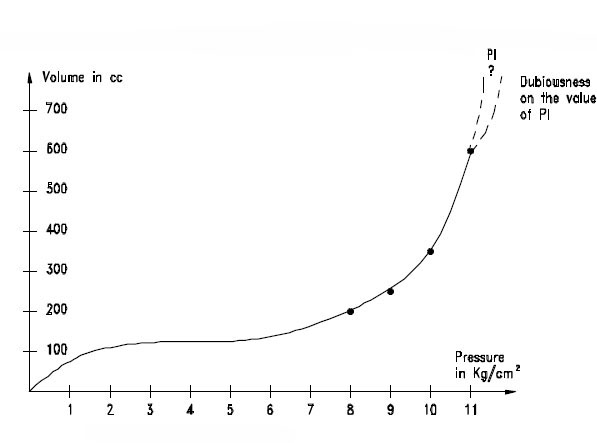
Then, a pressuremeter curve V = f(P) is obtained by drawing the deformations between 30 seconds and 1 minute versus the pressures. The curve presents 3 phases: the recompression phase, the pseudo-elastic phase, the plastic phase and rupture (figure 14, (from www.roctest.com)
Parameters obtained from pressuremeter and dilatometer tests are the limit pressure (pl), the creep pressure (pf) and the pressuremeter modulus (E). The pressuremeter modulus is based on a theoretical equation (Lame) giving the radial increment of a radial cavity in function of the pressure in an elastic medium. It varies according to the nature of the material (from Filliat, 1981):
Material Pressuremeter modulus E (MPa: 1 MPa = 10 bars)
Soft clay 0,5-3
Compact clay 3-30
Marl 1,5-10
Silty sand 3-10
Gravely sand 8-100
Calcareous rock 80-20000
The creep pressure corresponds to the end of the pseudo-elastic phase.
The limit pressure corresponds to the failure of the surrounding soil. It is given by the asymptote of the pressuremeter curve. As this asymptote is not always easy to define, the limit pressure is also defined as the pressure for which the volume of the initial cylindrical cavity has doubled.
Pressuremeter and dilatometer tests are rather used in soft terrains, but can be employed in all types of terrains, with high pressures. The instruments to carry out tests in the soils and soft rocks are called pressuremeters, the instruments to carry out tests in the rocks are called dilatometers.
The Menard pressuremeter test is the most common test. It consists of a tri-cellular probe giving a uniform and radial field of stresses in the central third. The radial deformation is deducted from the measurement of the injected volume. Parasitic dilatations are reduced with coaxial injection tubing. A very large number of Menard pressuremeter tests have been already performed in various materials, giving references of the long-term behaviour of structures and confidence in the use of empirical factors (figure 15 and 16).
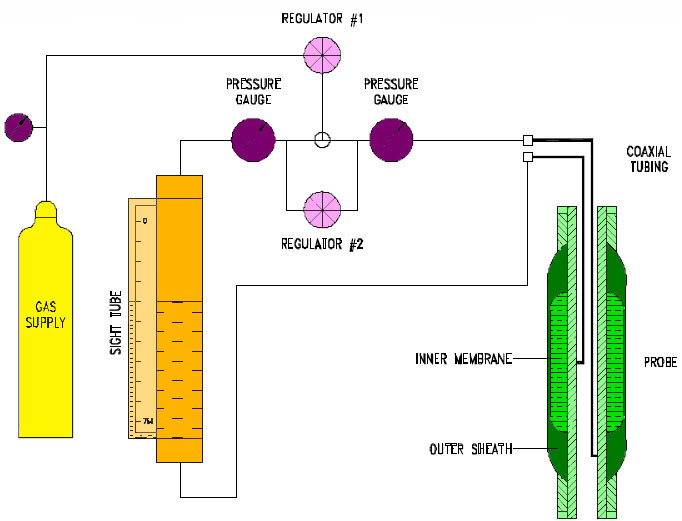
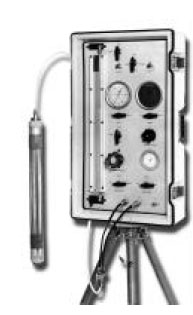
Other pressuremeters and dilatometers exist. They can have a mono-cellular cell, can be hydraulically pressurized, etc.
Laboratory tests also exist to assess mechanical properties of soils, such as the direct shear test and the triaxial shear test•to find the shear strength parameters of soil samples.
3. Hydrological characteristics:
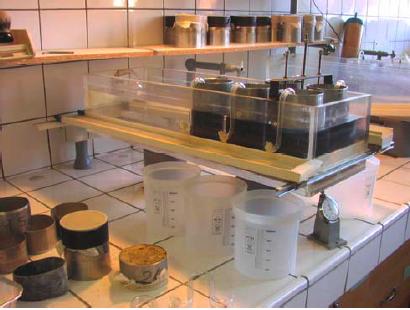
Infiltrometer is a device used to measure in-situ the rate of water infiltration into soil. Both single ring and double ring infiltrometers exist, and at constant head or falling head. The Beerkan method is a simple three-dimensional infiltration test under constant head conditions, made in single cylinders. This test provides cumulative infiltration as a function of time. Measurements of particle size, initial and final water content, and dry bulk density are also required.
The cylinder is positioned at the soil surface and inserted to a depth of about 1 cm into the topsoil, to prevent lateral losses of water. The surface vegetation is removed, while the roots remain in-situ (figure 17). A fixed volume of water is poured into the cylinder at time zero, and the elapsed time during the infiltration of the known volume is measured. When the first volume has completely infiltrated, a second known volume of water is added to the cylinder, and the time needed for this to infiltrate is measured (cumulative time). The procedure is repeated for a series of about 8-15 known volumes of water. Then, cumulative infiltration time is used in infiltration equations to determine the saturated hydraulic conductivity.
Hydraulic conductivity (K) describes the ease with which water can move through pore spaces or fractures. It depends on the intrinsic permeability of the material and on the degree of saturation. Saturated hydraulic conductivity (Ksat) describes water movement through saturated media.
As Ksat increases, the permeability and thus the susceptibility to slope movement also incresases (from Musy et al., 1992):Ksat (m.s-1) 10-1 10-2 10-3 10-4 10-5 10-6 10-7 10-8 10-9 10-10 10-11
Permeability Permeable Semi-permeable Impermeable
Material Gravel Gravely sand
Coarse sand
Fine sand Fine sand
Coarse silt
Clayey silt Silty clay Homogeneous clay
Ksat is a parameter of the Darcy’s law, which is a phenomologically equation that describes the flow of a fluid through a porous medium in saturated conditions (Q: flow, H:head):
Laboratory tests also exist to determine the saturated hydraulic conductivity. The constant-head permeameter is based on the Darcy’s law. An undisturbed soil sample is collected in-situ in a known volume cylinder. Then in the laboratory the volume of water flowing through the soil sample is measured over a period of time. By knowing the volume V of water measured, length L of the sample, cross-sectional area S of the sample, time t required for the quantity of water V to be discharged, and head H, Ksat can be calculated:
B. Measurement of displacements:
The main criteria to determine slope instability is the displacement. Indeed, kinematics monitoring provides a direct check on the stability of soil and rock slopes. Large movements are nearly always preceded by small displacements and accelerations that may be detected with instrumentation of sufficient sensitivity. Structural failure is commonly associated with a gradual acceleration of displacements. The time interval between the detection of the movement and the eventual collapse of a slope depends on the characteristics of the ground and on the sensitivity and reliability of the instruments. In most circumstances, a warning period from several days to weeks, or even months, may be achieved.
1. Measurements of distances and coordinates
Investigation of surface displacements can be achieved with several instruments measuring distances. A theodolite is a conventional topometric survey technique to measure distances. It is often used to monitor settlement at the crest of a slope or along the intermediates benches on a slope face. It measures both horizontal and vertical angles. A modern theodolite consists of a telescope mounted movably within two horizontal and vertical axis. It is mounted on a tripod (figure 19).
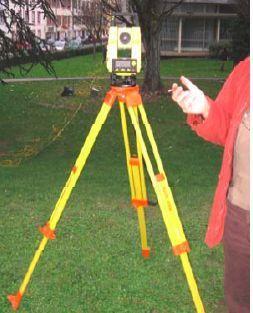
Before use, a theodolite must be placed precisely and vertically over the target to be measured and its vertical axis must be aligned with local gravity. It can be done using a plumb bob and a spirit level. The theodolite can also be mounted on a tribrach, which consists of two triangular metal plates, which are connected at their corners by thumbscrews. The bottom plate is mounted on the tripod and by turning the thumbscrews, it is possible to level the theodolite. The theodolite can be motorized or not.
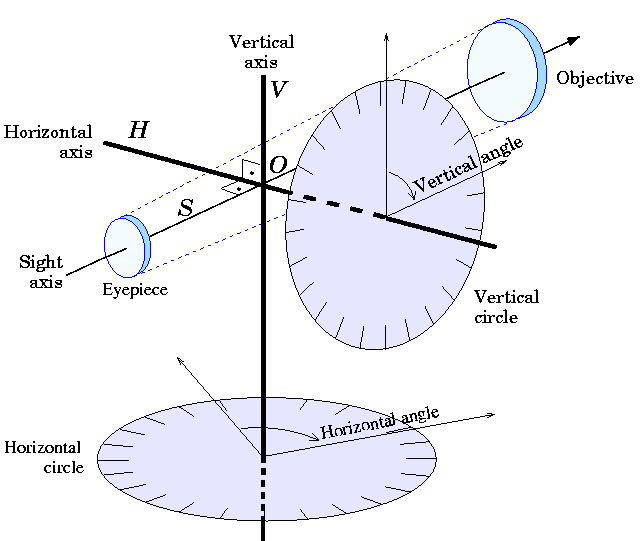
Both axis in the theodolite are equipped with graduated circles. The axis must be mutually perpendicular. The condition where they deviate from perpendicularity is referred to as horizontal axis error. The optical axis of the telescope, called sight axis must be perpendicular to the horizontal axis. If not, the deviation is called collimation error. These errors are regularly determined by calibration, and removed by mechanical adjustment (figure 20).
The modern theodolites employ a laser beam to measure the distances. The distance is measured with the time taken for the beam to travel from the instrument to the target. This distance between a fixed and stable instrument base and a target on the slope face can be used directly as a measure of slope movement. The accuracy of electro-optic measurement is generally from 1 to 10 mm. It is limited by atmospheric temperatures and pressure variations. Lines of sight located in zones of atmospheric turbulence should be avoided.
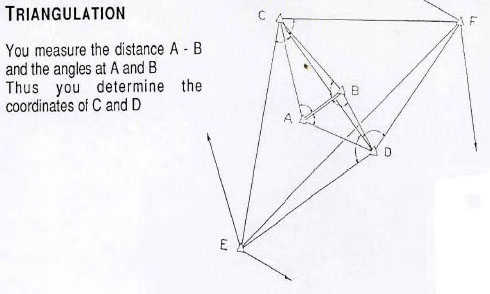
Alternatively the target coordinates may be determined by triangulation and trilateration calculations (figure 21).
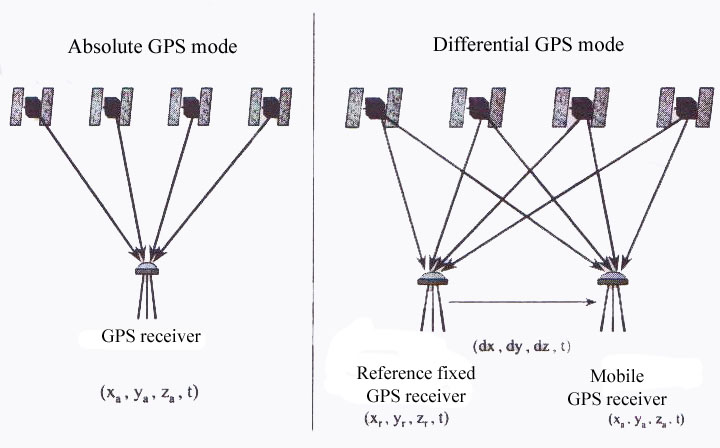
The Global Positioning System (GPS) is a widely used instrument to measure active deformations of the Earth’s crust, providing 3-D coordinates of a target. The monitoring of landslides with GPS is usually performed using repeated campaigns, as a complement to conventional topometric methods (teodolithe).
GPS is based on a constellation of 26 Medium Earth Orbit satellites, which transmit microwave signals. Each satellite has an atomic clock, and continually transmits messages, each containing the current time at the start of the message, parameters to calculate the location of the satellite and the general system health. The signals travel at the speed of light through outer space, and slightly slower through the atmosphere.
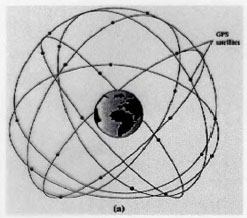
The GPS receiver uses the arrival time to compute the distance to each satellite, from which it determines its position using geometry and trigonometry (trilateration method). A typical GPS receiver calculates its position using the signals from four satellites.
Two utilization modes exist (figure 23): absolute mode provides a “real-time” absolute position with accuracy between 10 and 100 m. Only one receiver is needed. Advantages are that this method is simple and many measurements can be made in a short time. To obtain a better accuracy, differential mode is used. Two receivers are used and the obtained position is relative. Accuracy is function of the type of receiver and the duration of observation sessions. The differential system can be static or cinematic. In the cinematic differential mode, one receiver is fixed and one is mobile (figure 24). It provides positions with millimetre-level accuracy.
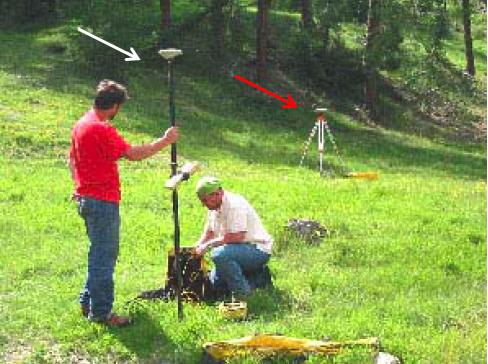
Although high accuracy obtained with GPS, continuous monitoring of landslides with GPS is not usually performed because of the cost of such a system compared to conventional deformation monitoring techniques. In addition, millimetre-level accuracy can be obtained for long observation sessions (typically 24 h), it decreases with the duration of the sessions, because of errors introduced by variations of the satellite constellation and multipath effects when the radio signals reflect off surrounding terrain. However, in case of inaccessible terrains, GPS appears to be the only one method to provide reliable position measurements.
2. Use of remote-sensing techniques:
Remote-sensing is the collecting of information about an object or phenomenon by the use of sensing devices not in physical or intimate contact with the subject under investigation. Both space and aerial remote-sensing techniques exist, thus including space-borne and air-borne platforms. Interpretation of satellital and aerial photographies is widely used for many purposes in slope instability investigations. Notably, a sequence of photographs taken at suitable time intervals can be compared to examine the progressive development of slides.
There are two kinds of remote-sensing techniques. On the one hand, passive sensors detect natural energy (radiation) that is emitted or reflected by the object or surrounding area being observed. Reflected sunlight is the most common source of radiation measured by passive sensors. On the other hand, active sensors emit energy in order to scan objects and areas and then detect and measure the radiation that is reflected by the object. RADAR (Radio Detection and Ranging) is an example of active satellital remote-sensing. The most advanced RADAR technology is SAR interferometry (synthetic aperture radar).
It is a powerful tool, providing an image representing the motion with a centimetric precision and with a decametric resolution. Data acquired by SAR systems can provide digital elevation models in three dimensions. Moreover, this technique has already proven its capability to detect and to map movement fields in landslide areas. One of the currently operating space-borne radar systems is the European ERS-2 satellite, whose side-looking SAR sensor images the Earth from an orbit about 780 km above the Earth surface.
LIDAR (Light Detection and Ranging) is an other advanced remote-sensing technology similar to RADAR technology: the range to an object is determined by measuring the time delay between transmission of a pulse and detection of the reflected signal. The difference with RADAR system is that LIDAR system uses shorter wavelengths of the electromagnetic spectrum, typically in the ultraviolet, visible, or near infrared. RADAR system uses radio waves or microwaves. Then, LIDAR is a air-borne technology, instead of a space-borne technology. It is used to measure heights of objects and features on the ground more accurately than with RADAR technology.
Terrestrial photogrammetry also exists. Photographs are taken from grounds stations and are measured in a stereo comparator.
3. Measurements of surface displacements and cracks, joints and faults
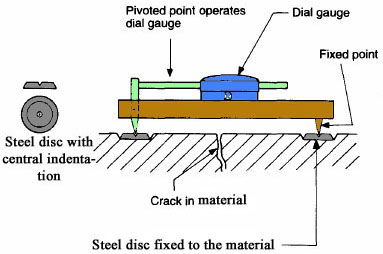
Monitoring of tension cracking that develops at the crest of the potentially unstable slope can provide useful information concerning the mechanisms and directions of movement. First, it can be helpful to mark the entire length of each crack with spray paint and to delineate the pattern of cracking on plans and cross-sections of the structure. At each subsequent date of observation it is then possible to note the appearance of new cracks, and the elongation of cracks previously marked.
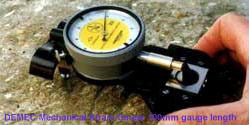
Then, several portable instruments are available to measure the expansion in aperture of the cracks. An example is the Demec gauge (demountable mechanical strain gauge) designed originally for measuring crack movements in concrete beams. Steel discs with a central indentation for locating the gauge are cemented on the rock surface on each side of the crack. The portable gauge employs a dial indicator actuated by a level system and is used to measure the distance between the discs.
Extensometers are also employed to measure extension movements at the ground surface. Two steel or aluminium anchor bolts are secured in the ground by grouting on each side of the crack or the crown. The most common extensometer consists of an Invar cable (FeSi) tight between the two anchor bolts. One bolt is anchored in the instable area and one bolt is anchored in the stable area. One end of the cable is mounted with a pulley and one end has a freely suspended weight. Displacement of the instable material makes the cable wind round the pulley. A potentiometer connected to the axis of the pulley creates an electric signal. This signal is then converted into extension distance (figure 27).
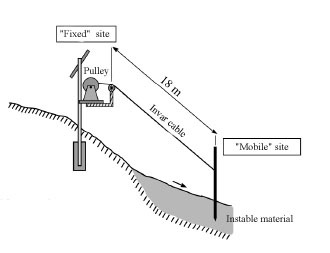
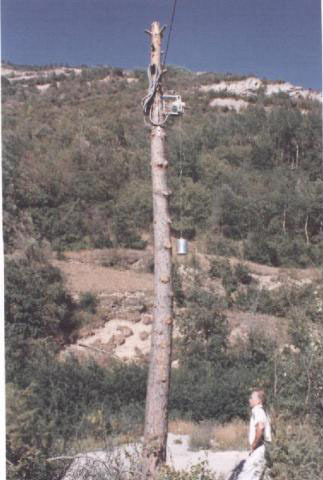
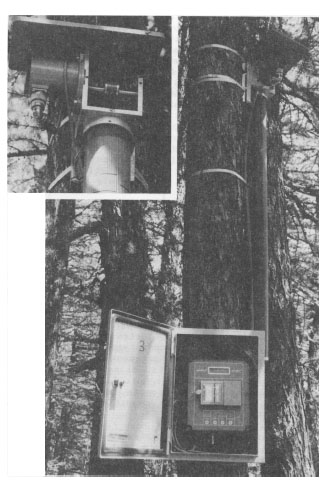
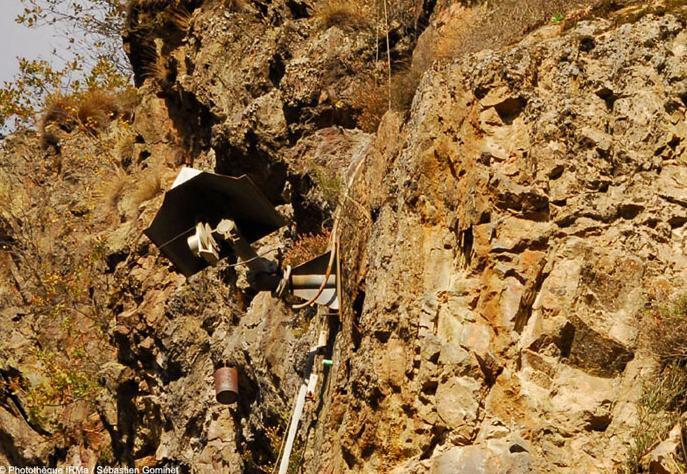
They continuously measure aperture of the most active cracks with an accuracy of 0,1 mm. The suspended weight is well visible (from www.irma-grenoble.com)
4. Measurements of sub-surface displacements
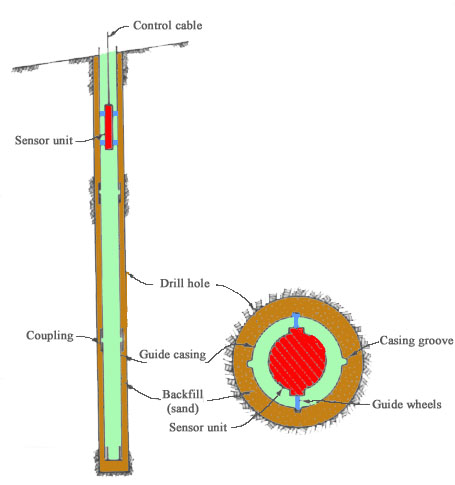
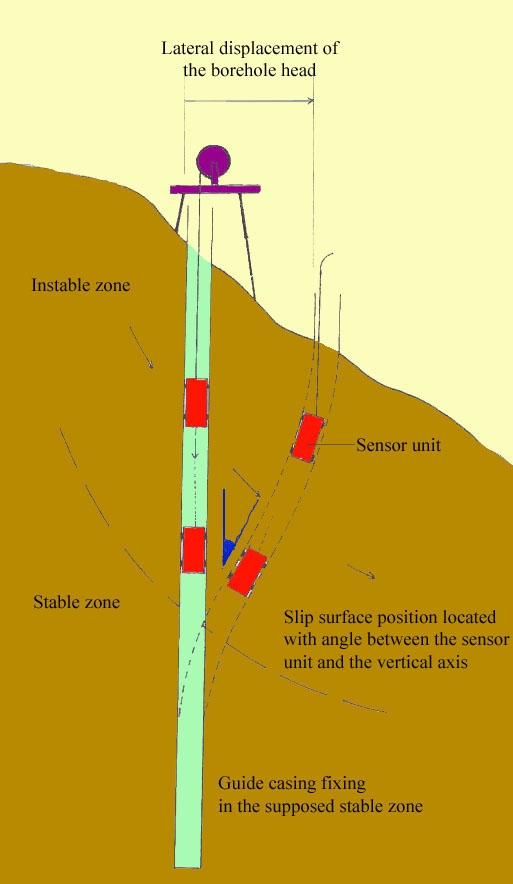
The inclinometer measures the change in inclination of a casing in a borehole and thus allows the distribution of lateral movements to be determined as a function of depth and time. In a landslide, this method is used to define the slip surface or zones of movement relative to stable zones. Inclinometer is also used to monitor dams, bulkheads and other earth-retaining structures.
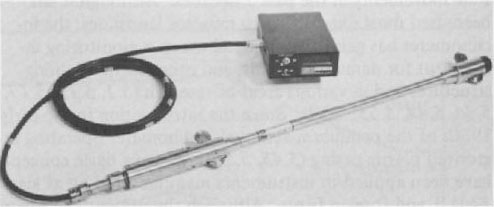
An inclinometer system has four components (figures 31 and 32):
- A guide casing is permanently installed in a vertical borehole into the ground. This casing may be made of plastic, steel or aluminium. It is fixed into the rock, so it is in movement with the slope,
- A portable sensor unit is commonly mounted in a carriage designed for operation in the guide casing,
- A control cable raises and lowers the sensor unit in the casing and transmits electrical signals to the surface,
- A portable control and readout unit at the surface supplies power, receives electrical signals and displays readings in dial or digital format.
The responses to slope changes in the casing are monitored and recorded at the surface. Readings are taken at fixed, usually equal increments throughout the entire depth. Instruments differ primarily in the type of sensor used, in the accuracy with which the sensor detects the inclination, and in the method of alignment and depth control within the borehole.
C. Measurements of groundwater levels and pressures
Groundwater has an important influence on the stability of soil and rock slopes (>>More details on the role of water). Piezometric monitoring is necessary to determine excessive water discharge or excessive water pressure.
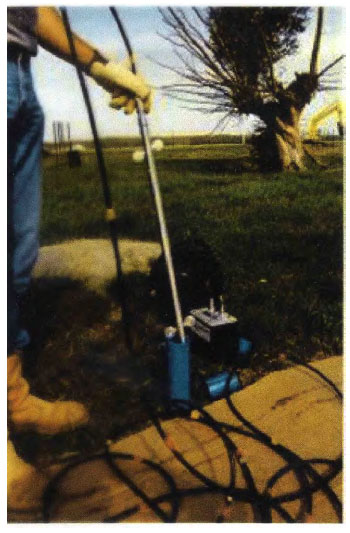
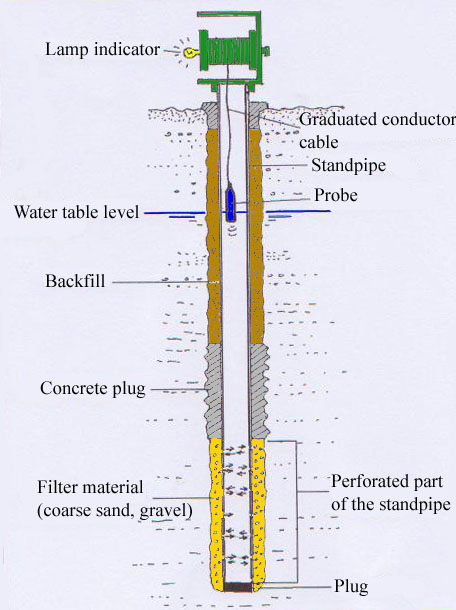
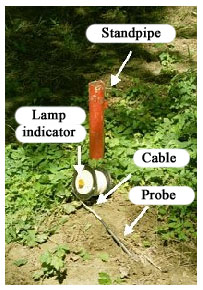
Water pressure is monitored using a piezometer, a geotechnical method which consists of a standpipe inserted in a drillhole. The standpipe is a tube perforated at its lower end or fitted with a porous plastic ceramic element. Its end is packed with filter material (coarse sand or gravel). The remainder of the borehole is backfilled with cement grout to hydraulically isolate the piezometer. Groundwater rises in the standpipe until water head is in equilibrium with water pressure in the ground around the piezometer tip.
Groundwater pressure in the tip is monitored using a water level probe. It is a twin conductor cable with the end of each conductor connected to a brass cylinder. Entry of the probe into the water completes an electric circuit and activates a buzzer or lamp indicator on the cable reel. The cable is graduated along its length so that the distance between the water level and the collar of the standpipe tube can be measured (figure 35).
Some piezometers are adapted to measure large pressures or large pressure fluctuations. For example, water in the standpipe can take a considerable time to be in equilibrium with water in the ground around the piezometer, from a few minutes to several days. It depends of the permeability of the ground. This can be a problem when relatively rapid fluctuations in groundwater pressure are expected and when the ground is impermeable.
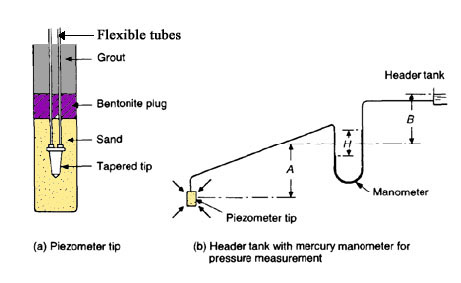
Hydraulic twin tube piezometer overcomes this problem, having a much smaller diameter of tube. This type of piezometer consists of a porous plastic or ceramic element connected by two flexible plastic tubes to a mercury manometer. The groundwater pressure is balanced by a head of mercury in the manometer, which is read against a calibrated scale. Generally, a hydraulic piezometer is only employed when the minimum head to be recorded is less than 8 meters below ground level.
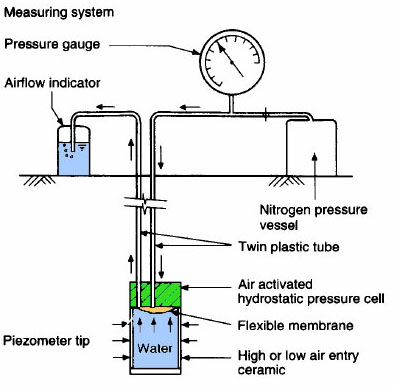
Pneumatic piezometer consists of a porous plastic or ceramic element connected to an air activated pressure cell, which is connected by flexible plastic tubes to a gauge system at the ground surface. Changes in groundwater pressure are measured by injecting air under pressure down one of the twin tubes, sufficient to balance the water pressure on the reverse side of the transducer diaphragm. The pressure sufficient to cause a return flow of air along the second plastic tube is recorded and is equal to the groundwater pressure. Only a very small diaphragm reflection is necessary to permit return flow, so that the volume change is minimal. This type of piezometer has a rapid response to groundwater pressure fluctuations.
Finally, electric piezometer consists of a porous plastic or ceramic element connected to an electric transducer. Electric leads from the transducer connect the piezometer tip to the readout instrument at the ground surface. This type of piezometer has a rapid response to groundwater pressure fluctuations and may be used as an alternative to the pneumatic types in materials of low permeability, such as clays. Moreover, electric piezometer allows automatic recording of pressure fluctuations.
When installing electric or pneumatic instruments, care should be taken to ensure that the piezometer tip is thoroughly saturated with de-aired water, since even small amounts of air in the equipment lead to inaccurate readings.
For examples of application of the different investigation techniques described in this part, go to 13.3. La Valette Case Study and 13.4 Super-Sauze CaseStudy.
References:
BESSON L., 2005. Les risques naturels: de la connaissance pratique à la gestion administrative. Editions Techni. Cités, Voiron, 60 p.
BONNARD C., 2007. Introduction on landslide investigation. Mountain Risks Workshop, Switzerland, 96 p.
BRAUD I., DE CONDAPPA D., SORIA J.M., HAVERKAMP R., ANGULO-JARAMILLO R., GALLE S., VAUCLIN M., 2005. Use of scaled forms of the infiltration equation for the estimation of unsaturated soil hydraulic properties (the Beerkan method). European Journal of Soil Sciences, n°56, p. 361-374
BRUNSDEN D., PRIOR D., 1984. Slope instability. John Wiley & Sons Ltd, Chichester
CAPELLE J.F., MARCIL L., QUIRION M., HUGHES J.M. 2005. Contributions of Canadian experiments to the development of pressuremeter techniques. Symposium International ISP5-PRESSIO, 10 p. www.roctest.com
CLAYTON C. R. I., MATTHEWS M. C., SIMONS N. E., 2005. Site investigation-Chapter 10:Basic field instrumentation for site investigation. University of Surrey. www.geotechnique.info
COLESANTI C., WASOWSKI J., 2006. Investigating landslides with space-borne Synthetic Aperture Radar (SAR) interferometry. Engineering Geology, n° 88, p. 173–199
LABORATOIRE CENTRAL DES PONTS ET CHAUSSEES (LCPC), 1994. Surveillance des pentes instables -guide technique. Ministère de l’Equipement, des Transports et du Tourisme (METT), Techniques et Méthodes des Laboratoires des Ponts et Chaussées, Paris
MALET J.P. Les « glissement de type écoulement » dans les marnes noires des Alpes du sud. Morphologie, fonctionnement et modélisation hydromécanique. PhD Thesis: Institut de Physique du Globe, Université Louis Pasteur de Strasbourg, 2003. 353 p.
MALET J.P., MAQUAIRE O., CALAIS E., 2002. Le GPS en géomorphologie dynamique. Application à la surveillance de mouvements de terrain (Super-Sauze, Alpes du Sud, France). Géomorphologie : relief, processus, environnement, n° 2, p. 165-180
RocTest. Pressuremeter and dilatometer tests — Interpretation and results. 34 p. www.roctest.com
SCHULZ H., 2006. Landslide susceptibility revealed by LIDAR imagery and historical records, Seattle, Washington. Engineering geology, n° 89, p. 67-87
SLOSSON E., KEENE A.G., JOHNSON J.A., 1992. Landslides/Landslide mitigation. In: Reviews of Engineering Geology, Volume IX, Colorado
TRANSPORTATION RESEARCH BOARD, 1978. Landslides: Analysis and Control. National Academy of Sciences, Special Report 176, Washington DC
VAN ASCH T., MALET J.P., VAN BEEK L., AMITRANO D., 2007. Techniques, issues and advances in numerical modelling of landslide hazard. Bulletin de la société géologique de France, n°178, p. 265-288
Website: en.wikipedia.org
Go to 8 Can LANDSLIDES be predicted?