BeSafeNet is a tool for promoting risk culture among populations.
It receives support from the European and Mediterranean Major Hazards Agreement of the Council of Europe.
Natural and technological disasters cause great human and economic losses. We cannot prevent many of them but there is a way to minimise the risk of disaster by sharing internationally valid and reliable information on the nature, causes and consequences of natural and technological disasters. A wide distribution of such information will help people better understand the potential risks and consequently better protect themselves against disasters.
Natural Hazards
Natural hazards are usually classified based on their causes and are thus subdivided into:
- Geological hazards are caused by earth processes either internal (volcanic eruptions and earthquakes) or external (landslides). Tsunamis are included among them as they are triggered by undersea earthquakes and other geological events.
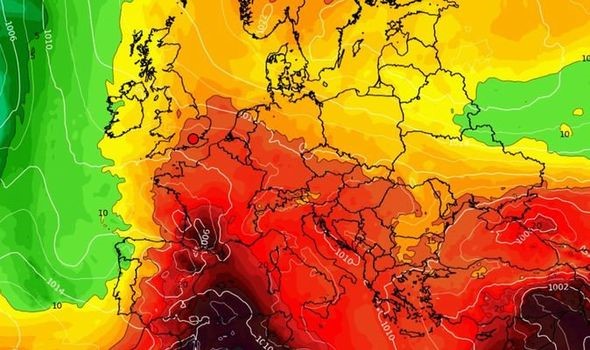
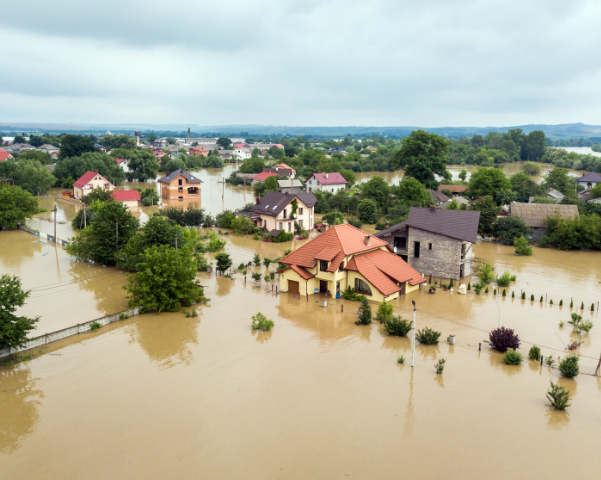
- Hydro-Meteorological hazards are most often weather-related phenomena (such as floods, droughts/desertification, landscape fires, avalanches, hurricanes/storm surges and sea level rise).
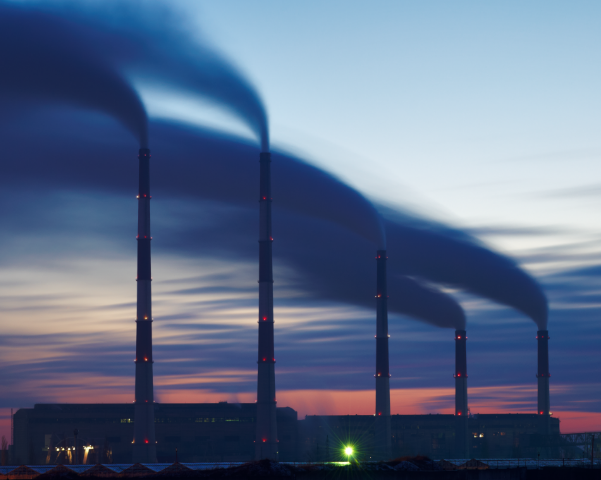
Technological Hazards
Accidents such as Bhopal in 1984, Chernobyl in 1986, Toulouse in 2001 or Fukushima in 2011 demonstrate the high risk of hazardous materials being released into the environment and the adverse effects on a large number of people in the immediate and wider environs.
Such chemical or radiological disasters, as well as dam failures, mainly result from human activity and consequently, their occurrence seems more foreseeable than natural catastrophes.