There are also vulnerability maps which show the coastal regions, coastal habitats or coastal communities ranked according to their vulnerabilities to impacts of sea level rise. These maps are important and necessary for adaptation planning of coastal areas since they give information about different factors which will be affected by sea level rise while the maps mentioned above are the results of specific scenarios which might happen in the future.
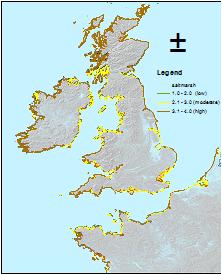
For vulnerability maps, different types of models are developed and used for different objectives. For example, the BRANCH project supported by EU funds (2008-2009) demonstrated the vulnerability of coastal habitats to sea level rise (Figure 1).
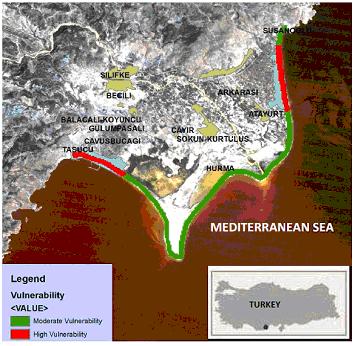
Another example of mapping vulnerability of coastal areas to sea level rise has been performed in Goksu Delta, Turkey as an example of vulnerability of deltas, which are to be most affected low lying lands along the coasts both physically and socio-economically. Using both human and physical impacts, the vulnerability map shows that Goksu Delta is mostly moderately vulnerable to sea level rise. But the settlement areas are highly vulnerable to impacts of sea level rise. These types of maps enable decision makers to determine the areas which need protection in terms of adaptive management policies and/or coastal protection structures. (Ozyurt and Ergin, 2009).