Pericolosità Naturali
Innalzamento livello del mare
Preparato da ICoD – Euro-Mediterranean Centre on Insular Coastal Dynamics (Valletta, Malta) & the Editorial Board

L’innalzamento del livello del mare può essere definito come un sollevamento della superficie del mare dovuta ad un innalzamento globale assoluto del livello degli oceani nel mondo; oppure ad un innalzamento relativo rispetto alla massa terrestre locale (che può a sua volta essere in abbassamento o in sollevamento). L’espressione è generalmente applicata ad attesi cambiamenti eustatici del livello del mare dovuti all’effetto serra e all’associato riscaldamento globale.
L’innalzamento del livello del mare può essere definito come un sollevamento della superficie del mare dovuta ad un innalzamento globale assoluto del livello degli oceani nel mondo; oppure ad un innalzamento relativo rispetto alla massa terrestre locale (che può a sua volta essere in abbassamento o in sollevamento). L’espressione è generalmente applicata ad attesi cambiamenti eustatici del livello del mare dovuti all’effetto serra e all’associato riscaldamento globale.
Il Livello Medio del Mare Locale (LMML) viene definito come l’altezza del mare rispetto ad un punto di riferimento a terra, mediata in un periodo di tempo (ad esempio un mese od un anno) sufficientemente lungo da garantire lo smorzamento delle fluttuazioni determinate da onde e maree. Si devono poi apportare correzioni che tengano conto dei movimenti verticali del suolo, i quali possono essere dello stesso ordine di grandezza (mm/anno) delle variazioni del livello del mare. Alcuni movimenti del suolo si devono all’equilibrio isostatico che viene progressivamente a ristabilirsi nel mantello a seguito della fusione delle calotte glaciali avvenuta alla fine dell’ultima età glaciale. Il peso delle masse glaciali spinge inizialmente il suolo verso quote più basse, ma, a seguito della loro fusione, il suolo riacquista lentamente la sua quota iniziale. Altri elementi che possono modificare l’LMML sono la pressione atmosferica, le correnti oceaniche, e le locali variazioni termiche degli oceani.
Le “variazioni eustatiche” (opposte a quelle locali) sono alterazioni a livello globale dei livelli dei mari, quali quelle derivanti da variazioni di volume d’acqua negli oceani di tutto il mondo o da variazioni di volume a livello del singolo bacino oceanico.
Sea level changes on a range of temporal and spatial-scales. The total volume of the ocean can change as a result of changes in ocean mass (addition of water to the ocean from the land) or expansion/contraction of the ocean water as it warms/cools.
In addition, the sea level does not change uniformly as water is added or taken away. There can be large regions of ocean with decreasing sea level even when the overall Global Mean Sea Level (GMSL) is increasing. Obviously there must be regions of ocean with trends correspondingly greater than the mean to balance out the regions with trends less than the mean. There are many processes that drive these changes.
Si possono verificare a seguito di variazioni di breve termine/periodiche (ad esempio maree, onde, sovralzi di tempesta e variazioni stagionali), di effetti geologici di breve termine (ad esempio terremoti e subsidenza) e di variazioni del livello del mare di lungo periodo, causate da scambi di masse d’acqua, da espansioni termiche e da effetti geologici di lungo periodo. Il riscaldamento globale, causato dalle crescenti concentrazioni di gas serra, rappresenta un significativo elemento propulsivo sia dell’incremento delle masse d’acqua oceaniche che dell’espansione termica degli oceani, a loro volta componenti essenziali dell’innalzamento attuale e futuro del livello del mare.
Una breve storia del livello del mare:
- Negli ultimi 140.000 anni, il livello del mare ha subito variazioni superiori a 120 m. La più ampia e recente variazione è quella determinata dalla fusione delle masse glaciali al termine dell’ultima età glaciale, che ha portato ad un innalzamento del livello del mare superiore a 120 m.
- Il livello del mare si è stabilizzato durante gli ultimi millenni e piccole variazioni si sono registrate tra il I secolo a.C. ed il 1800 d.C.
- Il livello del mare ha registrato un nuovo innalzamento durante il XIX secolo ed una accelerazione nei primi anni del XX secolo.
- Misure altimetriche satellitari mostrano un tasso di innalzamento del livello del mare di circa 3 mm/anno a partire dai primi anni ’90 del secolo scorso – si stima che tale tasso possa subire un ulteriore incremento in futuro.
| Short-term (periodic) causes | Time scale (P = period) | Vertical effect |
|---|---|---|
| Periodic sea level changes | ||
| Diurnal and semidiurnal astronomical tides | 12-24 h P | 0.2-10- m |
| Spring tides | Twice a month | * |
| Rotational variations (Chandler wobble) | 14 month P | * |
| Meteorological and oceanographic fluctuations | ||
| Atmospheric pressure | Hours to months | – 0.7 to 1.3 m |
| Winds (storm surges) | 1-5 days | Up to 5 m |
| Evaporation and precipitation (may also follow long-term pattern) | Days to weeks | |
| Ocean surface topography (changes in water density and currents) | Days to weeks | Up to 1 m |
| El Nino southern oscillation | 6 months every 5-10 yr | Up to 0.6 m |
| Seasonal variations | ||
| Seasonal water balance among oceans (Atlantic. Pacific. Indian) | * | * |
| Seasonal variations in slope of water surface | * | * |
| River runoff floods | 2 months | lm |
| water density changes (temperature and salinity) | 6 months | 0.2 m |
| Seasonal Seiches | ||
| Seiches (standing waves) | Minutes to hours | Up to 2 m |
| Earthquakes | ||
| Tsunamis (generate catastrophic long-period waves) | Hours | Up to 10 m |
| Abrupt change in land level | Minutes | Up to 10 m |
| * Effects change locally. Source: http://en.wikipedia.org/wiki/Sea_level_rise | ||
A number of geological processes contribute to short-term changes in measured sea level. A few examples are:
- earthquakes and other small-scale geological events
- sinking of land (subsidence) through compaction of sediments and/or withdrawal of ground water
- sinking of land through withdrawal of oil
On time scales of months and longer, sea level changes as a result of both changes in ocean mass (addition of water to the ocean from the land) and expansion/contraction of the ocean water as it warms/cools.
Exchange of water between “reservoirs” is an important contribution to sea level change. A significant part of this is through the hydrological cycle, where water evaporates from the ocean, resides in the atmosphere, then returns to the ocean either directly or via reservoirs (snow, ice, lakes, rivers, groundwater etc). There are both annual variations as well as longer-term variations. For example, extraction of water from underground aquifers can increase the mass of the ocean whereas the storage of water in dams can decrease the mass of the ocean.

Contributions from non-polar Glaciers
A major contribution to sea level change is from the changing mass of glaciers, and the ice sheets. At the time of the last glacial maximum (140000 years ago) when sea level was more than 120 m below present level, there were major ice sheets in North American and northern Europe and Asia.
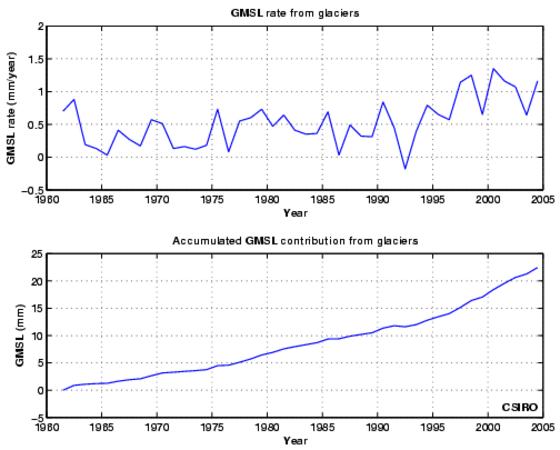
Several different estimates are proposed for the contribution of non-polar Glaciers by scientists. Kaser et al and others estimate the melting of glaciers and ice caps (excluding the glaciers surrounding Greenland and Antarctica) contributed to sea level rise by about 0.4 mm per year from 1961 to 1990 increasing to about 1.0 mm per year from 2001-2004. Another group of scientists, Meier et al, state that mass loss from glaciers is dominating the eustatic component of sea level rise in the 21st century, providing 1.1 mm/year of the total eustatic contribution of 1.8 mm/year in 2006. (Meier, M.F>, M.B. Dyurgerov, U.K. Rick, S. O’Neel, W.T. Pfeffer, R.S. Anderson, S.P. Anderson and A.F. Glazovsky (2007), Glaciers Dominate Eustatic sea level Rise in th 21st Century, Science, 317, 1064-1067).
Contributions from the Ice Sheets
The ice sheets of Greenland and Antarctica have the potential to make the largest contribution to sea level rise, but they are also the greatest source of uncertainty. Since 1990 there has been increased snow accumulation at high elevation on the Greenland ice sheet, while at lower elevation there has been more widespread surface melting and a significant increase in the flow of outlet glaciers. The net result is a decrease in the mass of the Greenland ice sheet – a positive contribution to sea level rise. For the Antarctic Ice Sheet, the uncertainty is greater. There are insufficient data to make direct estimates for the preceding decades. At present, the mass gain of the Antarctic Ice Sheet due to increased thickening of the East Antarctic Ice Sheet does not appear to compensate for the mass loss due to the increased glacier flow on the Antarctic Peninsula and the West Antarctic Ice Sheet. Modelling studies suggest that the Antarctic Ice Sheet is still responding to changes since the last ice age and that this may also be contributing to sea level rise. (http://www.cmar.csiro.au/sealevel).
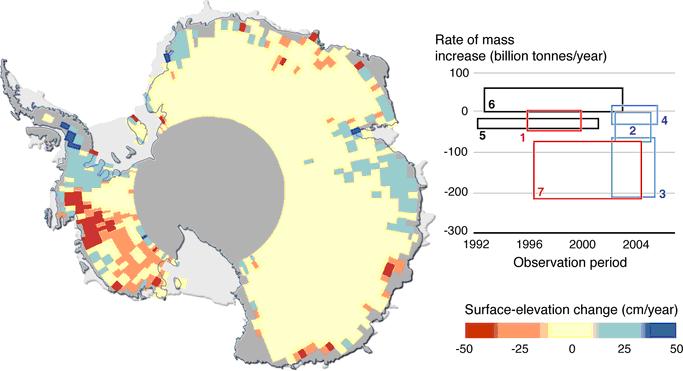
Figure 1 shows rates at which the ice-sheet mass was estimated to be changing based on radar-altimeter data (black), mass-budget calculations (red), and satellite gravity measurements (blue). Rectangles depict the time periods of observations (horizontal) and the upper and lower estimates of mass balance (vertical). Measurements by satellite techniques based on gravity indicate mass loss at a rate of 138 ± 73 billion tonnes per year during 2002-2005, mostly from the West Antarctica Ice Sheet. That is equivalent to a rise in global sea level of 0.4 ± 0.2 mm per year, or 10-30% of the global rate measured since the 1950s, and is in good agreement with recent mass budget estimates.
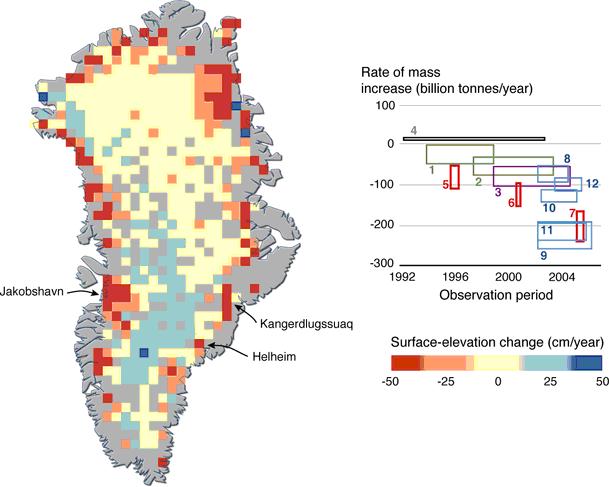
Mass-balance estimates for Greenland show thickening at high elevations since the early 1990s at rates that increased to about 4 cm per year after 2000, consistent with expectations of increasing snowfall in a warming climate. However, this mass gain is far exceeded by losses associated with large increases in thinning of the ice sheet near the coast. Total loss from the ice sheet more than doubled, from a few tens of billions of tonnes per year in the early 1990s, to about 100 billion tonnes per year after 2000, with perhaps a further doubling by 2005. These rapidly increasing losses result partly from more melting during warmer summers, and partly from increased discharge of ice from outlet glaciers into the ocean. In particular, the speeds of three of Greenland’s fastest glaciers approximately doubled since 2000, although two of them have partially slowed since.
Ocean thermal expansion is one of the main contributors to long-term sea level change, as well as being part of regional and short-term changes. Water expands as it warms and shrinks as it cools.
From 1961 to 2003, the upper 700 metres of the global oceans absorbed about 3.6 x 10²¹ Joules per year, increasing global mean sea level (GMSL) by about 22 millimetres. This is equivalent to contributing about 0.52 mm/year to GMSL, and also to an air-sea flux of 0.36 Watts per square metre over the ocean area considered (65°S to 65°N). This contribution to GMSL is about one third of the total GMSL trend (1.6 mm/year) over this period.
From 1955 to 1995, earlier estimates of ocean thermal expansion is estimated to have contributed about 0.4 mm/year to sea level rise, less than 25 per cent of the observed rise over the same period. For the 1993 to 2003 decade, when the best data are available, thermal expansion was estimated to be significantly larger, at about 1.6 mm/year for the upper 750 m of the ocean alone, about 50 per cent of the observed sea level rise of 3.1 mm/year. (source: http://www.cmar.csiro.au/sealevel)
FIGURE
Figure 1: The top panel of the above plot show changes in the heat content of the top 700 metres of the ocean from 1960 to 2007. The bottom panel shows the change in thermosteric sea level. (http://www.cmar.csiro.au/sealevel)
One of the main long-term geological contributions to sea level is Glacial Isostatic Adjustment (GIA) – which is also known as Post-Glacial rebound (PGR). The ice sheets of recent ice ages compressed the earth’s mantle as they advanced causing the mantle to subside and also to squeeze material out in front of the ice sheet, producing what is known as the “forebulge”. Since the ice sheets retreated the mantle has been slowly returning towards its original configuration. This has produced the following effects:
- regions which were under the ice sheets (e.g. much of northern Eurasia and North America) are rising – in some cases by up to 7mm/year.
- regions which were on the forebulge (e.g. the east coast of the U.S.) are sinking, typically at rates of 1mm/year or slightly more.
- regions further away are moving vertically at smaller rates as part of the overall adjustment that this causes. For example, Australia is rising at ~0.3-0.4 mm/year.
These effects contribute to changes in measured sea level through the vertical movements at tide gauge sites and also through the change in volume of the ocean basins as this long-term geological adjustment goes on.
Plate tectonics also contributes, but this is, generally, a much smaller effect.
Thermal expansion is producing about half of the current 3mm/year increase in global sea level. This contribution has increased from around 0.5 mm/year over the second half of the 20th century to around 1.6 mm/year over the last 12-14 years. This contribution is expected to continue at least at this level over the next century or more due to greenhouse-gas-induced warming of the atmosphere and ocean.
Due to the very patchy and sparse (especially as we go back in time) body of ocean temperature data that is available to estimate longer-term contributions, the contribution over most of the 20th century is hard to estimate reliably.
A major contribution to recent sea level rise is from the melting of glaciers, and contributions from the Greenland (both surface melting and iceberg calving and the Antarctic ice sheet (iceberg calving only). This is believed to produce about one third or more of the current 3mm/year annual increase in global sea level. The contribution from the ice sheets is poorly understood at the moment and is an active area of research. The melting of the Greenland ice sheet alone could increase global mean sea level by around 7 metres. This would probably take around 1,000 years, but it is believed that ice melt from Greenland could still contribute significantly to sea level rise over the next 50-100 years.
A scala globale
Il Livello Medio del Mare a scala Globale è aumentato di 195 mm tra il 1870 ed il 2004 e continua a crescere ad un tasso piuttosto regolare, di poco superiore a 3 mm/anno. In media, si stima che al 2100 i livelli del mare si innalzeranno di circa mezzo metro in gran parte del globo. In molte zone, tale innalzamento di 50 cm causerà la distruzione di intere spiagge e di una significativa porzione delle linee di costa.
A scala locale
Per coloro che vivono su isole a quote basse rispetto al livello del mare, come le isole Tuvalu, Kiribati e Maldive, dove la quota più alta è solo 2-3 m superiore al livello del mare attuale, un innalzamento di 50 cm del livello del mare significherebbe la distruzione di significative porzioni di isole per erosione e per allagamento. Anche se rimanessero al di sopra del livello del mare, molte popolazioin isolane vedrebbero ridotte le loro scorte di acqua potabile a causa dell’intrusione del cuneo salino nei loro acquiferi.
Sebbene le popolazioni di tali isole siano numericamente significative, esse risultano irrilevanti se messe a confronto con le decine di milioni di persone che vivono nelle basse aree costiere dell’Asia meridionale. Tra queste, le linee di costa del Pakistan, dell’India, dello Sri Lanka e di Myanmar. Aree densamente popolate come il delta del Nilo e parti del Bangladesh potrebbero divenire disabitate, spingendo centinaia di migliaia di persone ad abbandonare le loro terre.
L’innalzamento del livello del mare diviene particolarmente evidente in quelle zone interessate da fenomeni di subsidenza del suolo su larga scala, che amplificano l’innalzamento relativo del livello del mare rispetto al suolo (come ad esempio Gippsland, Victoria e la costa statunitense del Golfo del Messico). Per contro, alcune zone hanno subito un impatto minore poiché l’innalzamento del livello del mare viene compensato da un innalzamento anche del livello del suolo. L’Australia si sta alzando di circa 0,3-0,4 mm/anno come conseguenza del riequilibrio isostatico glaciale, ma deve ancora iniziare a goderne gli effetti.
A sea level rise of only a few meters would inundate thousands of square kilometers of highly populated and developed land. In Amsterdam, London, Rotterdam, Portsmouth or other low-lying coastal areas; communities, highways, factories, ports, railroads and many types of industry would be flooded.
The complete melting of Greenland would raise sea levels by 7 meters (23 feet). But even a partial melting would cause a one-meter (three-foot) rise. Such a rise would have a devastating impact on low-lying island countries which would be entirely submerged.
L’innalzamento del livello del mare potrà essere percepito sia attraverso le variazioni del livello medio del mare, sia, con ancor maggior enfasi, attraverso variazioni dei livelli del mare legati ad eventi estremi. Anche se non si registrassero variazioni nelle condizioni meteorologiche estreme (per esempio l’aumento dell’intensità dei cicloni tropicali), l’innalzamento del livello del mare potrebbe superare con maggior frequenza i limiti estremi. Questa variazione nella frequenza degli eventi estremi è stata già osservata in diverse aree. Una maggiore frequenza degli eventi estremi dipenderà dalle condizioni locali, ma gli eventi che attualmente avvengono una volta ogni 100 anni potrebbero verificarsi, da qui al 2100, una volta ogni pochi anni.
Nel prossimo secolo, anche se la frequenza degli eventi estremi non subisse alcun incremento, milioni di persone potrebbero essere comunque colpite dagli effetti diretti dell’innalzamento del livello del mare. A volte si prendono a confronto le grandi variazioni del livello del mare avvenute nel corso delle ultime età glaciali, allo scopo di ridimensionare l’importanza di quelle attuali, relativamente meno ampie. Questo sulla base dell’assunzione che l’umanità possa adattarsi ai cambiamenti futuri così come lo ha fatto in passato. E’ ovvio che il punto debole di tale argomentazione risiede nel fatto che, in passato, gli abitanti di una regione avrebbero potuto agevolmente trasportare tutti i loro beni vitali in altri territori più ospitali qualora il loro territorio fosse stato reso inospitale dalle variazioni del livello del mare. Oggi, con le grandi infrastrutture ubicate a livelli prossimi a quello del mare (come ad esempio a Londra e a New York) e con milioni di persone che vivono in regioni a rischio (come ad esempio il Bangladesh ed il Vietnam del sud), la medesima soluzione non è più percorribile.
Gli effetti fisici legati all’innalzamento del livello del mare possono essere identificati nella perdita di suolo, causata dall’inondazione di aree a basse quote, e nell’erosione delle spiagge e dei promontori rocciosi, nell’ingressione salina all’interno degli acquiferi e nelle acque superficiali, nell’innalzamento delle falde e nell’aumento dei danni provocati da inondazioni e tempeste.
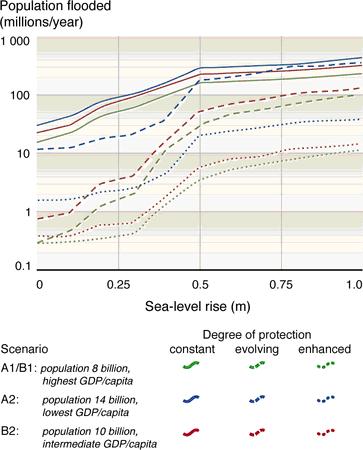
A rise of a few mm per year by the sea, although not threatening spectacular inundation is still extremely important. Direct land loss of low lying areas can rapidly (decadal to centennial periods) damage or destroy coastal ecosystems. Rising sea levels inundate wetlands and other low-lying lands, erode beaches, intensify flooding, and increase the salinity of rivers, bays, and groundwater tables. Some of these effects may be further compounded by other effects of a changing climate.
Coastal wetland ecosystems, such as salt marshes and mangroves are particularly vulnerable to rising sea level because they are generally within a few feet of sea level (IPCC, 2007). Wetlands provide habitat for many species, play a key role in nutrient uptake, serve as the basis for many communities’ economic livelihoods, provide recreational opportunities, and protect local areas from flooding.
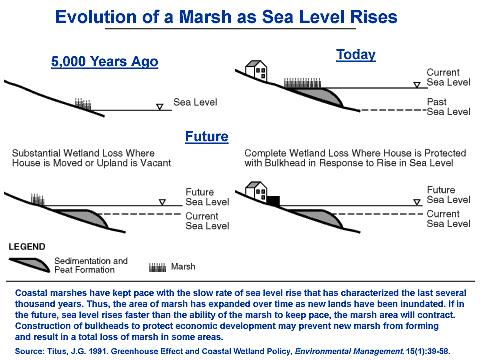
As the sea rises, the outer boundary of these wetlands will erode, and new wetlands will form inland as previously dry areas are flooded by the higher water levels. The amount of newly created wetlands, however, could be much smaller than the lost area of wetlands – especially in developed areas protected with bulkheads, dikes, and other structures that keep new wetlands from forming inland. The IPCC suggests that by 2080, sea level rise could convert as much as 33 percent of the world’s coastal wetlands to open water. (IPCC, 2007). Tidal wetlands are generally found between sea level and the highest tide over the monthly lunar cycle. As a result, areas with small tide ranges are the most vulnerable.
In addition to inundation, long-term sea level rise can cause erosion and shoreline retreat by creating a sediment budget deficit. Coastal erosion is caused by a variety of factors, which broadly fall into two categories. First, sand often migrates along the shore, causing some areas to erode and others to accrete. Second, rising sea level causes virtually all shores to erode. Using a model first developed by Danish coastal engineer Per Bruun, coastal geologists have estimated that a one-meter rise in sea level will cause beaches to erode 50 to 100 meters from New England to Maryland, 200 meters along the Carolinas, 100 to 1000 meters along the Florida coast, and 200 to 400 meters along the California coast. These model calculations are roughly consistent with the observed rate of erosion. (http://www.cmar.csiro.au/sealevel)
The effect of rising mean sea levels will be felt most profoundly during extreme storm conditions when strong winds and falling pressure bring about a temporary and localised increase in sea level known as a storm surge. Storm surges occurring on higher mean sea levels will enable inundation and damaging waves to penetrate further inland increasing flooding, erosion and the subsequent detrimental impacts on built infrastructure and natural ecosystems. In the tropics storm surges are caused by tropical cyclones while elsewhere mid-latitude storms and their associated cold fronts are the main cause of storm surges.
Sea level rise also increases the vulnerability of coastal areas to flooding during storms for several reasons. First, a given storm surge from a hurricane or northeaster builds on top of a higher base of water. Considering only this effect, it is estimated that existing development in the U.S. Coastal Zone would experience a 36-58 percent increase in annual damages for a 30 cm rise in sea level, and a 102-200 percent increase for a 1 m rise. Shore erosion also increases vulnerability to storms, by removing the beaches and dunes that would otherwise protect coastal property from storm waves (FEMA 2000). Sea level rise also increases coastal flooding from rainstorms, because low areas drain more slowly as sea level rises.
Other impacts of climate change may further enhance or mitigate coastal flooding. Flooding from rainstorms may become worse if higher temperatures lead to increasing rainfall intensity during severe storms. An increase in the intensity of tropical storms would increase flood and wind damages.
Rising sea level increases the salinity of both surface water and ground water through salt water intrusion. If sea level rise pushes salty water upstream, then the existing water intakes might draw on salty water during dry periods. Salinity increases in estuaries also can harm aquatic plants and animals that do not tolerate high salinity. Shallow coastal aquifers are also at risk (IPCC, 2007). As rising water levels submerge low-lying portions of the coastal areas, portions of the aquifers would become saline.
All the mentioned impacts of sea level rise can cause human loss due to increased level of storm surges, socio-economic losses of coastal communities as well as impact on national economies, environmental problems such as loss of wetlands, dunes and associated ecosystem habitats and loss of cultural heritage due to inundation of these sites (http://epa.gov/climatechange/effects/coastal/index.html).
Le misure adottate dalle persone per proteggere la loro proprietà privata dall’innalzamento del livello del mare possono sortire effetti indesiderati, in generale sull’ambiente e sull’uso pubblico della costa e, in maniera più specifica, sulle spiagge e sui corsi d’acqua. Storicamente, i proprietari di terreni lungo le coste sabbiose hanno eretto varie tipologie di muri per arrestarne l’erosione. Sebbene queste strutture proteggano la proprietà, allo stesso tempo possono cancellare le spiagge, che hanno un’estensione generalmente inferiore a 3 m. Oltre alla loro funzione di protezione dell’ambiente e della linea di costa, le spiagge sono una risorsa capace di produrre rilevanti guadagni attraendo turisti e potendo essere utilizzate per la pesca, per attività ricreative, per i trasporti e per l’atterraggio di piccoli aerei.
La subsidenza del suolo, derivante dalla compattazione dei sedimenti provocata da attività antropiche e/o per estrazione di acque sotterranee e/o petrolio, può contribuire in modo significativo all’innalzamento del livello del mare, con tutte le relative conseguenze.
La maggior parte degli impatti derivanti dall’innalzamento del livello del mare sono direttamente condizionati dalle attività antropiche che avvengono lungo le aree costiere, come la costruzione di dighe lungo i fiumi che hanno l’effetto di ridurre il rifornimento di sedimenti alle aree costiere, aumentando la possibilità di erosione della costa. L’utilizzo eccessivo di acque sotterranee aumenta la vulnerabilità delle risorse di acqua potabile qualora vi sia un contemporaneo innalzamento del livello del mare. Anche la degradazione di strutture naturali di difesa della costa, come le dune e le foreste di mangrovia (a seguito di attività di escavazione e di costruzione) può amplificare negativamente le conseguenze dell’innalzamento del livello del mare, riducendo la naturale funzione protettiva di tali strutture.
Le forze condizionanti il recente innalzamento del livello del mare sono il riscaldamento globale ed il cambiamento climatico. Come mostrano le ricerche, la principale causa del riscaldamento globale è l’incremento della concentrazione di gas serra nell’atmosfera, a sua volta determinato dalle attività umane. Pertanto possiamo dire che le cause dell’innalzamento del livello del mare sono principalmente influenzate dalle attività umane.
Allo stesso tempo, questo significa che possiamo eliminare queste cause agendo in maniera differente. Per ridurre al minimo gli effetti del cambiamento climatico, dobbiamo iniziare a cambiare i nostri stili di vita il prima possibile, allo scopo di ridurre le quantità di gas serra emesse.
L’innalzamento del livello del mare rappresenta un elemento centrale nell’identificare, capire, descrivere e prevedere correttamente il cambiamento climatico. Durante il XX secolo gli oceani hanno immagazzinato ben più dell’80% del calore che ha riscaldato la terra. La conseguente espansione termica degli oceani, insieme alle variazioni nei volumi dei ghiacciai e delle calotte, condizioneranno fortemente l’innalzamento del livello del mare nel XXI secolo. Un elemento di crescente preoccupazione è rappresentato dalla fusione, ancor più rapida di quanto previsto in passato, delle calotte glaciali: su un arco temporale più ampio, le calotte della Groenlandia e dell’Antartide saranno probabilmente i responsabili principali dell’innalzamento del livello del mare.
During the 21st century, sea level will continue to rise due to warming from both past (20th century and earlier) and 21st century greenhouse gas emissions. The most robust projections of 21st century sea-level rise are the Assessments of the Intergovernmental Panel on Climate Change (IPCC) of 2001 and 2007.
In its 2007 assessment of global warming, the Intergovernmental Panel on Climate Change (IPCC) projected that global mean sea level is expected to rise between 0.18 to 0.59 meters (0.6 and 2 feet) in the next century.
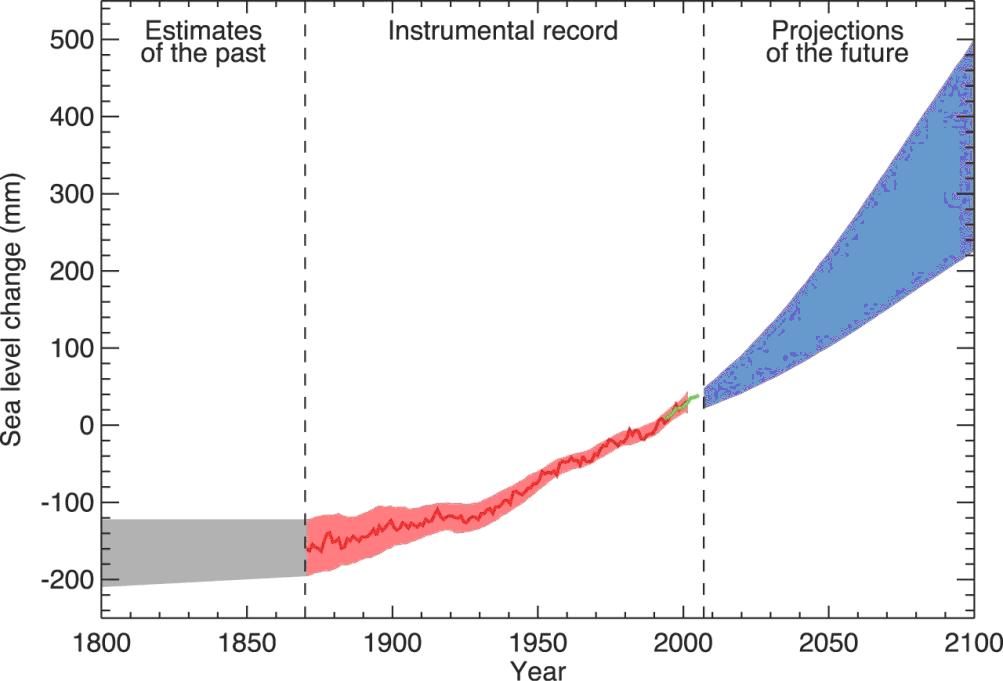
Estimates of the ocean thermal expansion are made with coupled climate models for the range of SRES greenhouse gas emission scenarios. Recent estimates indicate that non-polar glaciers and ice caps may contain only enough water to raise sea level by 15 to 37 centimetres (Lemke et al. 2007). The largest contribution is from large glaciers in regions with heavy precipitation, such as the coastal mountains around the Gulf of Alaska, or Patagonia and Tierra del Fuego in South America. Many of these glaciers flow into the sea or large lakes and melt quickly because the ice is close to melting temperature.
For Greenland, both glacier calving and surface melting contribute to mass loss. Over the last few decades surface melting has increased and now dominates over increased snowfall, leading to a positive contribution to sea level during the 21st century. For the majority of Antarctica, present and projected surface temperatures during the 21st century are too cold for significant melting to occur and precipitation is balanced by glacier flow into the ocean. (Lemke et al. 2007).
In addition to these surface processes, there are suggestions of a potential dynamical response (sliding of the outlet glaciers over the bedrock) of the Greenland and Antarctic ice sheets. In Greenland, there was a significant increase in the flow rate of many of the outlet glaciers during the early 21st century. One potential reason for this is increasing surface melt making its way to the base of the glaciers, lubricating their flow over the bed rock, consistent with increased glacier flow rates. Another effect which may be becoming more important is that, as the ice shelves around Antarctica and Greenland melt or break up (e.g. Larsen B) they allow the glaciers behind them to flow faster, leading to increased flow into the ocean.
When projecting future sea-level rise, we need to recognise that local trends related to decadal variability will be superimposed on the slowly increasing global-mean sea level. At this stage there is no agreed pattern for the longer-term regional distribution of projected sea-level rise. There are, however, several features that are common to most model projections – for example a maximum sea-level rise in the Arctic Ocean and a minimum rise in the Southern Ocean south of the Antarctic Circumpolat current.


Figure 8 The multi-model mean of the departure of the projected regional sea-level rise from the global-averaged (SRES A1B) projections for 2030 and 2970 (source: http://www.cmar.csiro.au/sealevel)
For the next few decades, the rate of sea-level rise is partly locked in by past emissions, and will not be strongly dependent on early 21st century greenhouse gas emission. However, sea level projections closer to and beyond 2100 are critically dependent on future greenhouse gas emissions, with both ocean thermal expansion and the ice sheets potentially contributing metres of sea-level rise over centuries for higher greenhouse gas emissions.
Present day contributions from the Greenland come from both surface melting and iceberg calving and for the Antarctic ice sheet from iceberg calving only. The contribution from the ice sheets is poorly understood at the moment and is an active area of research.
In the case of the Greenland Ice Sheet, if global average temperatures cross a point that is estimated to be in the range of 1.9°C to 4.6°C above pre-industrial values, surface melting is likely to exceed precipitation (Gregory and Huybrechts, 2006). The inevitable consequence of this is an ongoing shrinking of the Greenland Ice Sheet over a period of centuries and millennia. Total melting of the Greenland ice sheet alone would increase global mean sea level by around 7 metres. This conclusion is consistent with the observation that global sea level in the last interglacial, when temperatures were in this range, was several metres higher than it is today. This threshold (of melting exceeding precipitation) could potentially be crossed late in the 21st century.
Dynamic responses of the Greenland and/or West Antarctic Ice Sheets (sliding of the ice sheets over bedrock) could lead to a significantly more rapid rate of sea level rise than from surface melting alone. There is increasing evidence that this dynamic response may be occurring. (http://www.cmar.csiro.au/sealevel)
It is difficult for scientists to be more precise with sea-level projections because there are a number of uncertainties:
- Greenhouse gas concentrations
While scientists agree that the levels of greenhouse gases are rising, future increases depend on many factors, including population growth, energy use and the development of new technologies.
- Climate sensitivity
Climate sensitivity is the amount of atmospheric warming that results from a doubling of atmospheric carbon dioxide concentrations. It depends on the presence of greenhouse gases, and on feedback processes from clouds, water vapour and ice. This is a significant source of uncertainty in projections of long-term climate change.
- Ocean heat exchange
Heat moves between the atmosphere and the ocean’s surface. The temperature at the surface at any one time is influenced by what is going on in the ocean. Quite small changes in the transport of heat or salt can have large effects on surface temperature, and ultimately on climate. Ocean models have developed rapidly over the last two decades but accurately representing the most important ocean features remains a challenge.
- Ice
There is uncertainty about the response of the ice sheets in Greenland and Antarctica to hundreds of years of warmer temperatures. Scientists are concerned that there could be a rapid disintegration of the West Antarctic ice sheet, causing a rapid rise in sea level.
(source: http://science.org.au/nova/082/082key.htm).
Anche se le emissioni di gas serra venissero stabilizzate da qui alla fine del XXI secolo, è probabile che l’innalzamento del livello del mare, dovuto all’espansione termica degli oceani, avrà raggiunto solo la metà del suo livello previsto per il 2500.
In ogni caso, i danni possono essere ridotti al minimo se cominciamo ad agire subito! Potremo ridurre gli impatti negativi dell’innalzamento del livello del mare sia implementando misure volte a minimizzare le emissioni di gas serra, sia assumendo stili di vita più sostenibili rispetto all’ambiente.
La pianificazione territoriale futura dovrà tenere in adeguata considerazione il riscaldamento globale ed il relativo innalzamento del livello del mare al fine di garantire l’adattamento delle comunità locali rispetto alle conseguenze dell’innalzamento del livello del mare. Per esempio, la costruzione di muri protettivi lungo costa e l’esclusione delle aree a rischio dagli sviluppi urbanistici rappresentano misure di pianificazione che possono minimizzare il danno provocato dall’innalzamento del livello del mare nel prossimo secolo.
I proprietari privati, i governi federali, statali e locali stanno già iniziando a prepararsi in prospettiva dell’innalzamento del livello del mare. Alcune comunità costiere portano sabbia sulla spiaggia per allontanare l’erosione marina. I proprietari privati stanno innalzando le strutture esistenti in diverse zone depresse, incoraggiati da premi assicurativi più bassi sul rischio alluvioni.
Le città costiere dovrebbero adottare politiche che garantiscano alle spiagge, alle dune od alle aree umide la possibilità di migrare verso l’entroterra a seguito di un innalzamento del livello del mare. Alcuni stati proibiscono la costruzione di nuove abitazioni in aree che potranno essere erose nei prossimi 30-60 anni.
Attualmente, relativamente alla salinizzazione delle risorse idriche potabili, le autorità di gestione delle risorse idriche contrastano l’eccessiva salinizzazione utilizzando, durante i periodi siccitosi, l’acqua potabile contenuta in bacini di ritenzione. Una possibile risposta all’innalzamento del livello del mare potrebbe essere una maggiore scorta di acqua potabile durante la stagione piovosa affinché maggiori quantità d’acqua possano essere distribuite in occasione dei periodi siccitosi. D’altro canto, altri problemi nella gestione delle acque (ad esempio la prevenzione delle alluvioni) potrebbero ostacolare il risparmio di acqua per far fronte ad eventuali periodi di siccità. Gli impatti del cambiamento climatico sull’idrologia locale potrebbero compensare od accrescere i livelli di salinità a seguito dell’innalzamento del livello del mare.
L’innalzamento del livello del mare è un processo molto lento, se si pensa in termini di giorni, mesi o addirittura di anni. Per questo, ciò che si può fare laddove si verifica un innalzamento del livello del mare consiste, principalmente, nel prepararsi alle conseguenze dell’innalzamento stesso. L’adattamento è l’azione più importante da intraprendere per ridurre al minimo qualsiasi tipo di perdita in futuro.
Oltre all’adattamento, si dovrebbero adottare misure per mitigare il riscaldamento globale ed il cambiamento climatico da tradurre in politiche nazionali ed in stili di vita. Esistono diversi progetti di sensibilizzazione per informare il pubblico sulle misure da intraprendere per ridurre le emissioni di gas serra, quali il passaggio ad energie alternative rispetto ai combustibili fossili, l’implementazione di sistemi di isolamento delle nostre case per ridurre i consumi energetici, camminare invece che utilizzare l’auto ecc.
Le carte sono uno strumento importante per pianificare le misure d’adattamento delle comunità e delle aree costiere. Diversi tipi di carte ci informano del grado di impatto che può avere l’innalzamento del livello del mare sulle zone costiere, come ad esempio le carte delle inondazioni, che ci mostrano le zone che saranno permanentemente al di sotto del livello del mare rispetto a diversi possibili scenari di innalzamento del livello del mare. Un esempio di questo tipo di carte si può trovare all’indirizzo web http://flood.firetree.net/ in cui sono presenti aree dei Paesi Bassi e del Regno Unito che potrebbero essere alluvionate durante le diverse fasi dell’innalzamento del livello del mare. Si può scegliere un livello di innalzamento del livello del mare utilizzando un menu a tendina nell’angolo superiore sinistro della carta. I pulsanti di navigazione possono essere utilizzati per ingrandire, ridurre o spostare la carta.
There are also vulnerability maps which show the coastal regions, coastal habitats or coastal communities ranked according to their vulnerabilities to impacts of sea level rise. These maps are important and necessary for adaptation planning of coastal areas since they give information about different factors which will be affected by sea level rise while the maps mentioned above are the results of specific scenarios which might happen in the future.
For vulnerability maps, different types of models are developed and used for different objectives. For example, the BRANCH project supported by EU funds (2008-2009) demonstrated the vulnerability of coastal habitats to sea level rise (Figure 1).
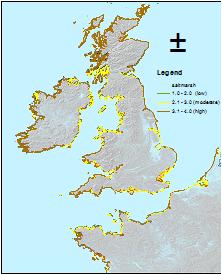
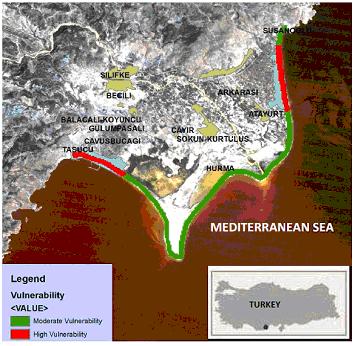
Another example of mapping vulnerability of coastal areas to sea level rise has been performed in Goksu Delta, Turkey as an example of vulnerability of deltas, which are to be most affected low lying lands along the coasts both physically and socio-economically. Using both human and physical impacts, the vulnerability map shows that Goksu Delta is mostly moderately vulnerable to sea level rise. But the settlement areas are highly vulnerable to impacts of sea level rise. These types of maps enable decision makers to determine the areas which need protection in terms of adaptive management policies and/or coastal protection structures. (Ozyurt and Ergin, 2009).
